Elastic Stack 7 : Packetbeat インストール2021/06/22 |
|
ネットワークパケット情報のデータ収集機能を提供する Packetbeat をインストールします。
|
|
| [1] | Packetbeat をインストールします。 事前に Elasticsearch リポジトリ設定済みであることが前提です。 |
|
[root@dlp ~]# dnf -y install packetbeat
|
| [2] | 基本的な設定をして Packetbeat を起動します。 |
|
[root@dlp ~]#
vi /etc/packetbeat/packetbeat.yml # 39行目 : 収集する項目を設定 # ICMPv4/ICMPv6 を無効にする場合は false に設定 # 44行目以降 : デフォルトで多くのポートが監視対象となっているが # 無効にする場合は [ports: ***] をコメントアウト packetbeat.protocols: - type: icmp # Enable ICMPv4 and ICMPv6 monitoring. Default: false enabled: true - type: amqp # Configure the ports where to listen for AMQP traffic. You can disable # the AMQP protocol by commenting out the list of ports. ports: [5672] ..... ..... # 159行目 : Kibana を使用する場合はコメント解除して出力先を指定 # Kibana で SSL 有効の場合は証明書に登録したホスト名と合わせる
setup.kibana:
.....
  host: "https://dlp.srv.world:5601"
# 190行目 : 出力先を指定する # デフォルト出力先は以下のように localhost の Elasticsearch # Logstash に出力する場合はコメントアウトして output.logstash 行関連を有効にする output.elasticsearch: # Array of hosts to connect to.l hosts: ["localhost:9200"] ..... ..... #output.logstash: # The Logstash hosts #hosts: ["localhost:5044"]
[root@dlp ~]#
vi /etc/packetbeat/packetbeat.reference.yml # 1791行目 : Kibana を使用する場合はコメント解除して出力先を指定 # Kibana で SSL 有効の場合は ssl 系設定をコメント解除 # 自己署名の SSL 証明書の場合は ssl.verification_mode を none に要変更 setup.kibana: # Kibana Host # Scheme and port can be left out and will be set to the default (http and 5601) # In case you specify and additional path, the scheme is required: http://localhost:5601/path # IPv6 addresses should always be defined as: https://[2001:db8::1]:5601 host: "dlp.srv.world:5601" # Optional protocol and basic auth credentials. protocol: "https" #username: "elastic" #password: "changeme" # Optional HTTP Path #path: "" # Use SSL settings for HTTPS. Default is true. ssl.enabled: true ..... ..... # after very careful consideration. It is primarily intended as a temporary # diagnostic mechanism when attempting to resolve TLS errors; its use in # production environments is strongly discouraged. # The default value is full. ssl.verification_mode: none[root@dlp ~]# systemctl enable --now packetbeat
|
| [3] | データが取り込まれているか確認しておきます。 |
|
# index 一覧 [root@dlp ~]# curl localhost:9200/_cat/indices?v health status index uuid pri rep docs.count docs.deleted store.size pri.store.size green open .kibana_7.13.2_001 zA_r0rrjT7OMUMVSGmRVfg 1 0 2100 184 2.8mb 2.8mb green open .apm-custom-link d1-9Pkn-RXOu_qhMOanvVA 1 0 0 0 208b 208b green open .kibana-event-log-7.13.2-000001 Y-rCmM6yTBKa9W5H1LeJ1g 1 0 1 0 5.6kb 5.6kb green open .apm-agent-configuration y3hQme2SQpGMtb64NLsNdA 1 0 0 0 208b 208b green open .async-search WRLoMwCITRKD3C_BrFJ9bw 1 0 45 1 71.3kb 71.3kb green open .kibana_task_manager_7.13.2_001 x6V232xKQLinqRedJRAbgw 1 0 10 3355 429.7kb 429.7kb yellow open test_index Vh0HutpLRciaMWX3pFo7Zg 1 1 1 0 5.5kb 5.5kb yellow open packetbeat-7.13.2-2021.06.22-000001 nYN59YPRQwGmDrMRXijZxA 1 1 1233 0 589kb 589kb yellow open sshd_fail-2021.06 HiOI2ac-RzK2BiwQ_gb-VQ 1 1 28 0 54.4kb 54.4kb yellow open metricbeat-7.13.2-2021.06.22-000001 aVbbCHScQBujmT8JMRdRBw 1 1 10475 0 6.1mb 6.1mb # index のドキュメント一覧 [root@dlp ~]# curl localhost:9200/packetbeat-7.13.2-2021.06.22-000001/_search?pretty
{
  "took" : 6,
  "timed_out" : false,
  "_shards" : {
    "total" : 1,
    "successful" : 1,
    "skipped" : 0,
    "failed" : 0
  },
  "hits" : {
    "total" : {
      "value" : 1471,
      "relation" : "eq"
    },
    "max_score" : 1.0,
    "hits" : [
      {
        "_index" : "packetbeat-7.13.2-2021.06.22-000001",
        "_type" : "_doc",
        "_id" : "p6H3MXoB8xzJeutJy6Kv",
        "_score" : 1.0,
        "_source" : {
          "@timestamp" : "2021-06-22T04:26:00.000Z",
          "event" : {
            "start" : "2021-06-22T04:24:55.554Z",
            "end" : "2021-06-22T04:25:59.178Z",
            "duration" : 63624511845,
            "dataset" : "flow",
            "kind" : "event",
            "category" : [
              "network_traffic",
              "network"
            ],
.....
.....
|
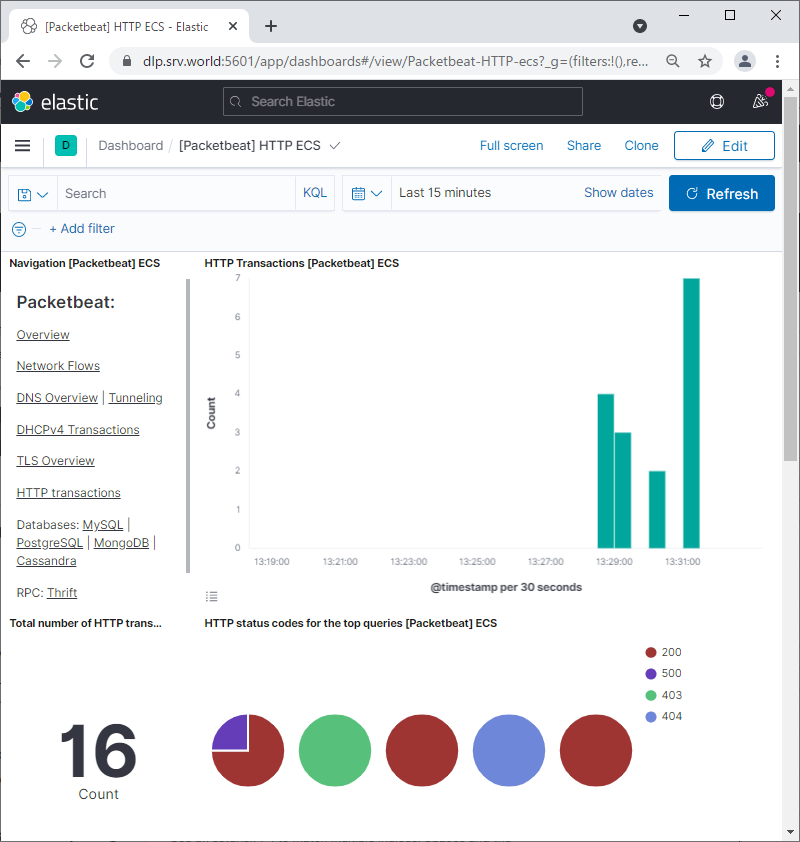
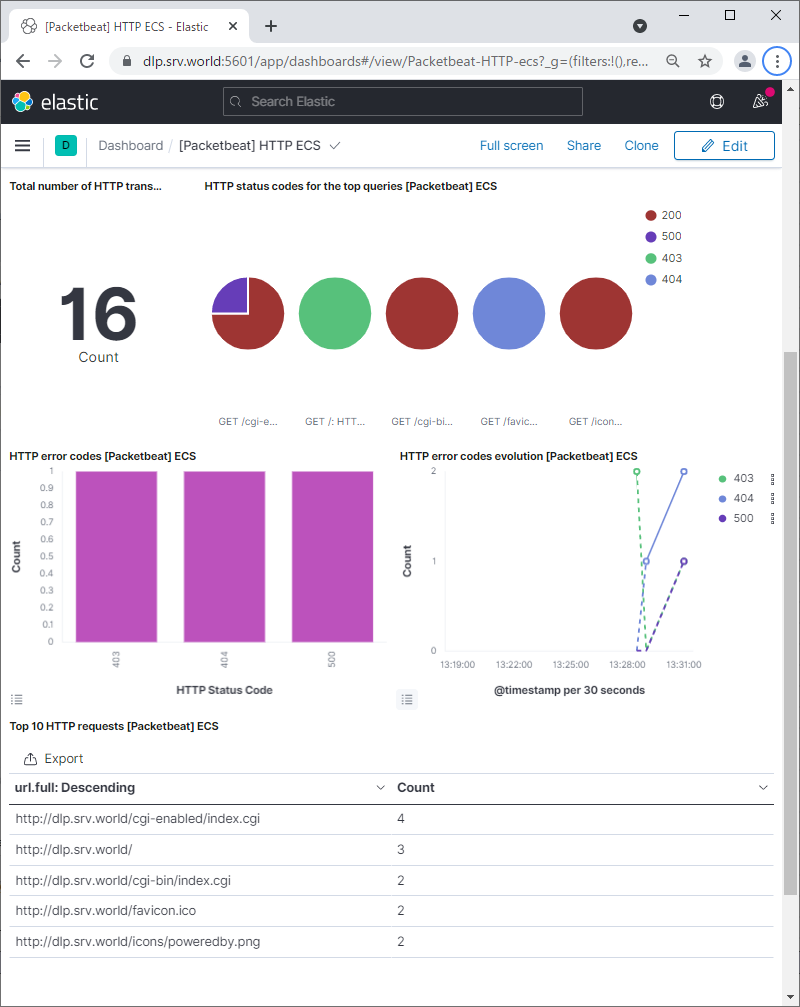
| [4] | Kibana を稼働させている場合は、サンプルダッシュボードへのデータインポートが可能です。 |
|
[root@dlp ~]# packetbeat setup --dashboards Loading dashboards (Kibana must be running and reachable) Loaded dashboards |
|
|
関連コンテンツ