Prometheus : Install2024/09/06 |
|
Install Systems monitoring and Alerting toolkit [Prometheus]. ⇒ https://prometheus.io/docs/introduction/overview/ |
|
| [1] | Install Prometheus Server and also Install [node-exporter] that includes features to get metric data of general resource on the System like CPU or Memory usage. |
|
root@dlp:~ # pkg install -y prometheus node_exporter
|
| [2] | Configure basic settings on [prometheus.yml]. |
|
root@dlp:~ #
vi /usr/local/etc/prometheus.yml
# my global config
global:
  scrape_interval: 15s # Set the scrape interval to every 15 seconds. Default is every 1 minute.
  evaluation_interval: 15s # Evaluate rules every 15 seconds. The default is every 1 minute.
  # scrape_timeout is set to the global default (10s).

# Alertmanager configuration
alerting:
  alertmanagers:
    - static_configs:
        - targets:
          # - alertmanager:9093

# Load rules once and periodically evaluate them according to the global 'evaluation_interval'.
rule_files:
  # - "first_rules.yml"
  # - "second_rules.yml"

# A scrape configuration containing exactly one endpoint to scrape:
# Here it's Prometheus itself.
scrape_configs:
  # The job name is added as a label `job=<job_name>` to any timeseries scraped from this config.
  - job_name: "prometheus"

    # metrics_path defaults to '/metrics'
    # scheme defaults to 'http'.

    static_configs:
      - targets: ["localhost:9090"]

  # add follows to monitor localhost
  - job_name: node
    static_configs:
      - targets: ['localhost:9100']
root@dlp:~ # service prometheus enable root@dlp:~ # service prometheus start root@dlp:~ # service node_exporter enable root@dlp:~ # service node_exporter start
|
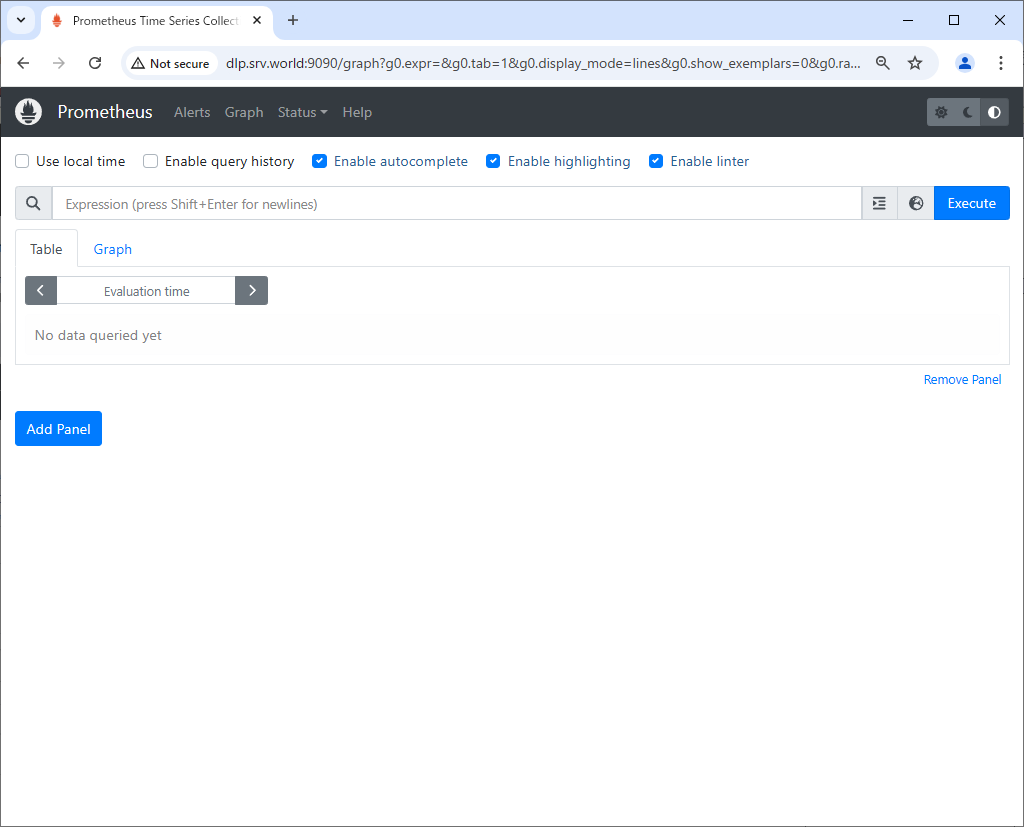
| [3] | Access to the [http://(Prometheus server's hostname or IP address):9090/] from a client host, Then, Prometheus Web UI is shown like follows. |
|
| [4] |
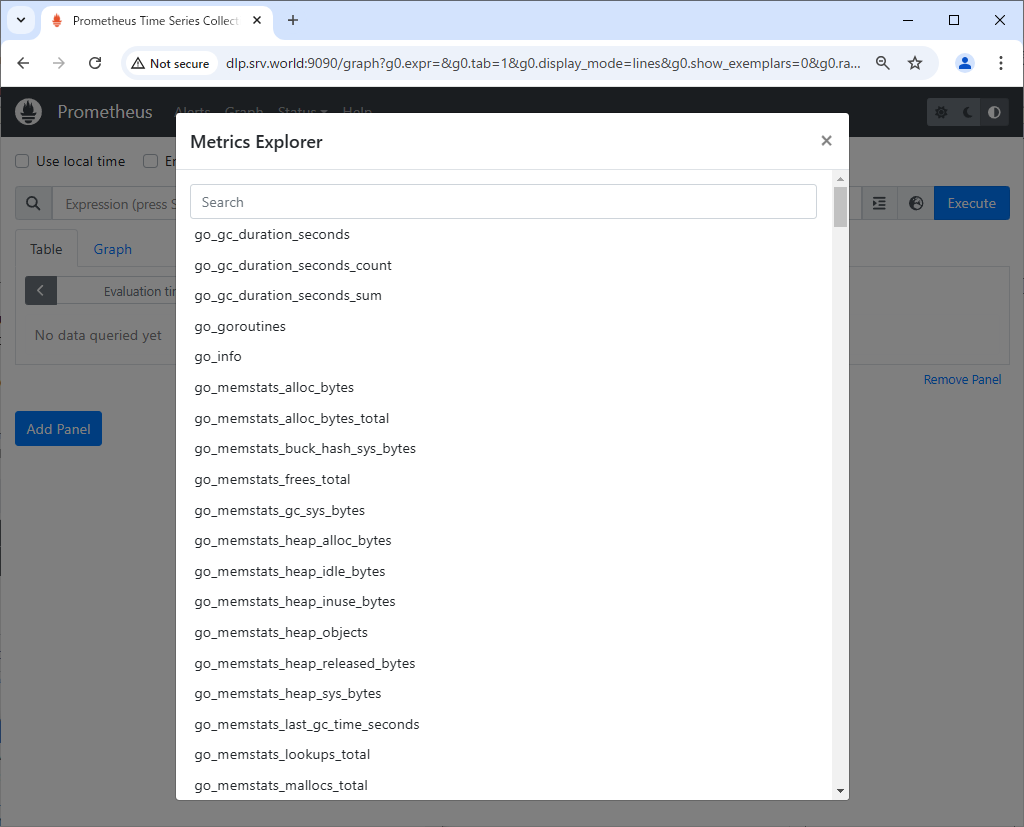
To click the icon to the left of the [Execute] button, it will display a list of various queries that can be used to reference the saved time series data.
Refer to the official document about usage of Expression Language.It's also possible to input queries directly on the input form above, by Prometheus [Expression Language]. ⇒ https://prometheus.io/docs/querying/examples/ |
|
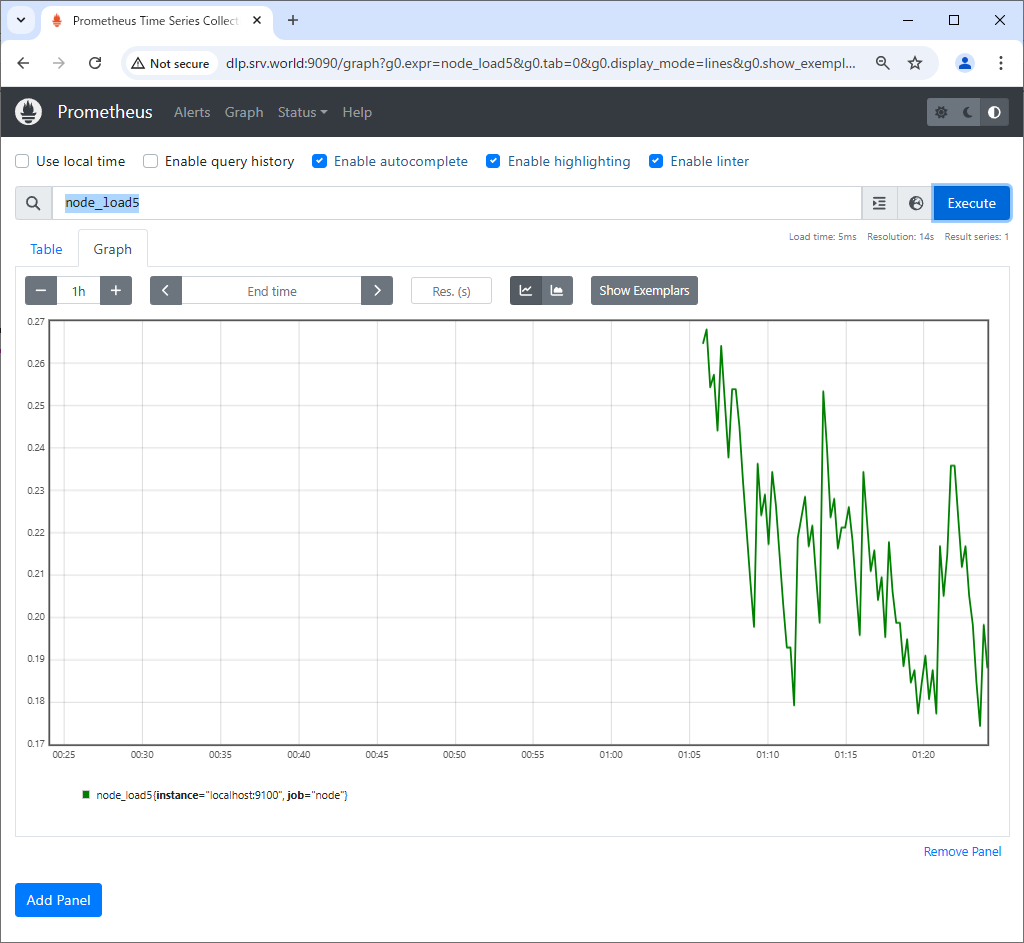
| [5] | This is the state of executing [node_load5]. |
|
Matched Content