Kubernetes : Deploy Prometheus2025/01/27 |
|
Deploy Prometheus to monitor metrics in Kubernetes Cluster. This example is based on the environment like follows.
+----------------------+   +----------------------+
|  [ ctrl.srv.world ]  |   |   [ dlp.srv.world ]  |
|     Manager Node     |   |     Control Plane    |
+-----------+----------+   +-----------+----------+
        eth0|10.0.0.25             eth0|10.0.0.30
            |                          |
------------+--------------------------+-----------
            |                          |
        eth0|10.0.0.51             eth0|10.0.0.52
+-----------+----------+   +-----------+----------+
| [ node01.srv.world ] |   | [ node02.srv.world ] |
|     Worker Node#1    |   |     Worker Node#2    |
+----------------------+   +----------------------+
|
| [1] |
Persistent storage is needed for Prometheus. |
| [2] | Install Prometheus chart with Helm. |
|
# output config and change some settings [cent@ctrl ~]$ helm inspect values bitnami/kube-prometheus > prometheus.yaml
[cent@ctrl ~]$
vi prometheus.yaml
.....
.....
    line 21 : specify [storageClass] to use
    defaultStorageClass: "nfs-client"
.....
.....
.....
    line 1261 : specify [storageClass] to use
    storageClass: "nfs-client"
.....
.....
.....
    line 2346 : specify [storageClass] to use
    storageClass: "nfs-client"
# create a namespace for Prometheus [cent@ctrl ~]$ kubectl create namespace monitoring namespace/monitoring created helm install prometheus --namespace monitoring -f prometheus.yaml bitnami/kube-prometheus
NAME: prometheus
LAST DEPLOYED: Mon Jan 27 11:43:14 2025
NAMESPACE: monitoring
STATUS: deployed
REVISION: 1
TEST SUITE: None
NOTES:
CHART NAME: kube-prometheus
CHART VERSION: 10.2.4
APP VERSION: 0.79.2

Did you know there are enterprise versions of the Bitnami catalog? For enhanced secure software supply chain features, unlimited pulls from Docker, LTS support, or application customization, see Bitnami Premium or Tanzu Application Catalog. See https://www.arrow.com/globalecs/na/vendors/bitnami for more information.

** Please be patient while the chart is being deployed **

Watch the Prometheus Operator Deployment status using the command:

    kubectl get deploy -w --namespace monitoring -l app.kubernetes.io/name=kube-prometheus-operator,app.kubernetes.io/instance=prometheus

Watch the Prometheus StatefulSet status using the command:

    kubectl get sts -w --namespace monitoring -l app.kubernetes.io/name=kube-prometheus-prometheus,app.kubernetes.io/instance=prometheus

Prometheus can be accessed via port "9090" on the following DNS name from within your cluster:

    prometheus-kube-prometheus-prometheus.monitoring.svc.cluster.local

To access Prometheus from outside the cluster execute the following commands:

    echo "Prometheus URL: http://127.0.0.1:9090/"
    kubectl port-forward --namespace monitoring svc/prometheus-kube-prometheus-prometheus 9090:9090

Watch the Alertmanager StatefulSet status using the command:

    kubectl get sts -w --namespace monitoring -l app.kubernetes.io/name=kube-prometheus-alertmanager,app.kubernetes.io/instance=prometheus

Alertmanager can be accessed via port "9093" on the following DNS name from within your cluster:

    prometheus-kube-prometheus-alertmanager.monitoring.svc.cluster.local

To access Alertmanager from outside the cluster execute the following commands:

    echo "Alertmanager URL: http://127.0.0.1:9093/"
    kubectl port-forward --namespace monitoring svc/prometheus-kube-prometheus-alertmanager 9093:9093

WARNING: There are "resources" sections in the chart not set. Using "resourcesPreset" is not recommended for production. For production installations, please set the following values according to your workload needs:
  - alertmanager.resources
  - blackboxExporter.resources
  - operator.resources
  - prometheus.resources
  - prometheus.thanos.resources
+info https://kubernetes.io/docs/concepts/configuration/manage-resources-containers/
[cent@ctrl ~]$ kubectl get pods -n monitoring NAME READY STATUS RESTARTS AGE alertmanager-prometheus-kube-prometheus-alertmanager-0 2/2 Running 0 76s prometheus-kube-prometheus-blackbox-exporter-6b99c88b6d-g7zqz 1/1 Running 0 89s prometheus-kube-prometheus-operator-57c6c84f6c-fll9m 1/1 Running 0 89s prometheus-kube-state-metrics-6df44d5556-xrjfd 1/1 Running 0 89s prometheus-node-exporter-h5khh 1/1 Running 0 89s prometheus-node-exporter-zwh2b 1/1 Running 0 89s prometheus-prometheus-kube-prometheus-prometheus-0 2/2 Running 0 76s # if access from outside of cluster, set port-forwarding [cent@ctrl ~]$ kubectl port-forward -n monitoring service/prometheus-kube-prometheus-prometheus --address 0.0.0.0 9090:9090 & |
| [3] | If you deploy Grafana, too, It's possible like follows. |
|
# output config and change some settings [cent@ctrl ~]$ helm inspect values bitnami/grafana > grafana.yaml
[cent@ctrl ~]$
vi grafana.yaml # line 618 : change to your [storageClass] persistence: enabled: true ## If defined, storageClassName: <storageClass> ## If set to "-", storageClassName: "", which disables dynamic provisioning ## If undefined (the default) or set to null, no storageClassName spec is ## set, choosing the default provisioner. (gp2 on AWS, standard on ## GKE, AWS & OpenStack) ## storageClass: "nfs-client"[cent@ctrl ~]$ helm install grafana --namespace monitoring -f grafana.yaml bitnami/grafana
NAME: grafana
LAST DEPLOYED: Mon Jan 27 11:48:48 2025
NAMESPACE: monitoring
STATUS: deployed
REVISION: 1
TEST SUITE: None
NOTES:
CHART NAME: grafana
CHART VERSION: 11.4.4
APP VERSION: 11.4.0

Did you know there are enterprise versions of the Bitnami catalog? For enhanced secure software supply chain features, unlimited pulls from Docker, LTS support, or application customization, see Bitnami Premium or Tanzu Application Catalog. See https://www.arrow.com/globalecs/na/vendors/bitnami for more information.

** Please be patient while the chart is being deployed **

1. Get the application URL by running these commands:
    echo "Browse to http://127.0.0.1:8080"
    kubectl port-forward svc/grafana 8080:3000 &

2. Get the admin credentials:

    echo "User: admin"
    echo "Password: $(kubectl get secret grafana-admin --namespace monitoring -o jsonpath="{.data.GF_SECURITY_ADMIN_PASSWORD}" | base64 -d)"
# Note: Do not include grafana.validateValues.database here. See https://github.com/bitnami/charts/issues/20629


WARNING: There are "resources" sections in the chart not set. Using "resourcesPreset" is not recommended for production. For production installations, please set the following values according to your workload needs:
  - grafana.resources
+info https://kubernetes.io/docs/concepts/configuration/manage-resources-containers/
[cent@ctrl ~]$ kubectl get pods -n monitoring NAME READY STATUS RESTARTS AGE alertmanager-prometheus-kube-prometheus-alertmanager-0 2/2 Running 0 6m17s grafana-5495c54848-vt5v8 1/1 Running 0 57s prometheus-kube-prometheus-blackbox-exporter-6b99c88b6d-g7zqz 1/1 Running 0 6m30s prometheus-kube-prometheus-operator-57c6c84f6c-fll9m 1/1 Running 0 6m30s prometheus-kube-state-metrics-6df44d5556-xrjfd 1/1 Running 0 6m30s prometheus-node-exporter-h5khh 1/1 Running 0 6m30s prometheus-node-exporter-zwh2b 1/1 Running 0 6m30s prometheus-prometheus-kube-prometheus-prometheus-0 2/2 Running 0 6m17s # if access from outside of cluster, set port-forwarding [cent@ctrl ~]$ kubectl port-forward -n monitoring service/grafana --address 0.0.0.0 3000:3000 & |
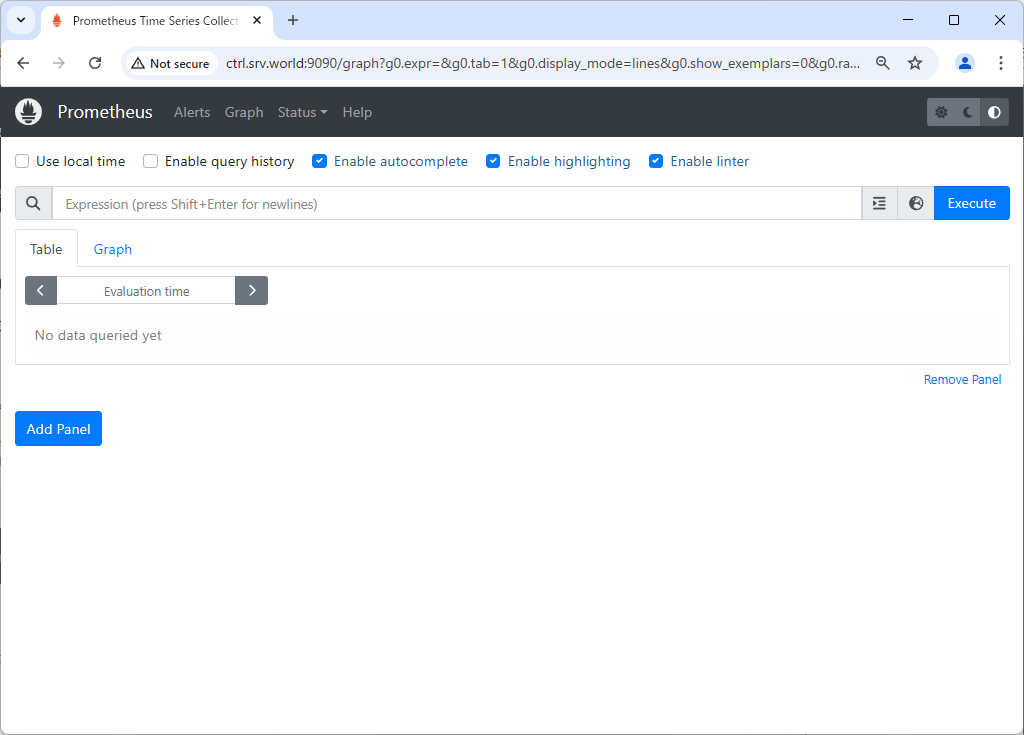
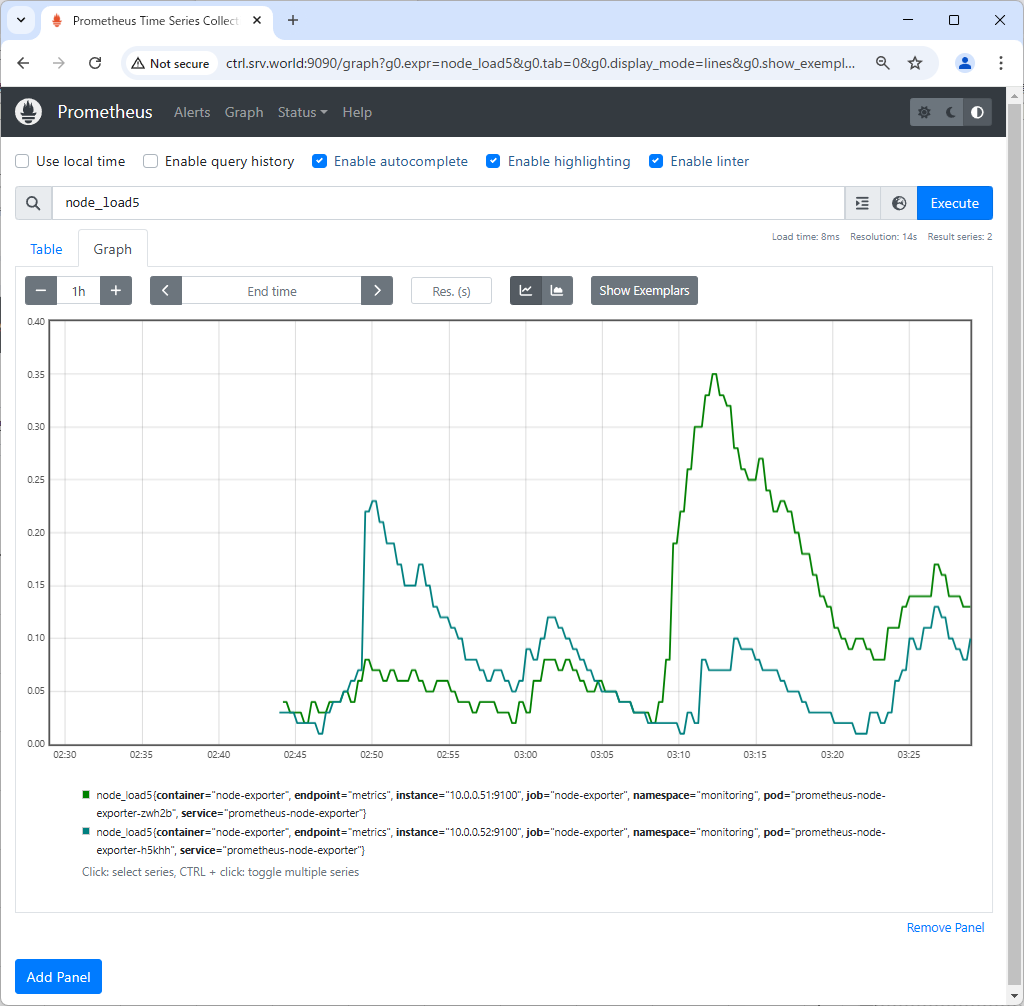
| [4] |
If you access to Prometheus UI from a Host in cluster, access to the URL below with an Web browser. ⇒ http://prometheus-kube-prometheus-prometheus.monitoring.svc.cluster.local If you set port-forwarding, access to the URL below on a client computer in your local network. ⇒ http://(Manager Node Hostname or IP address):(setting port)/ That's OK if following Prometheus UI is displayed. |
|
|
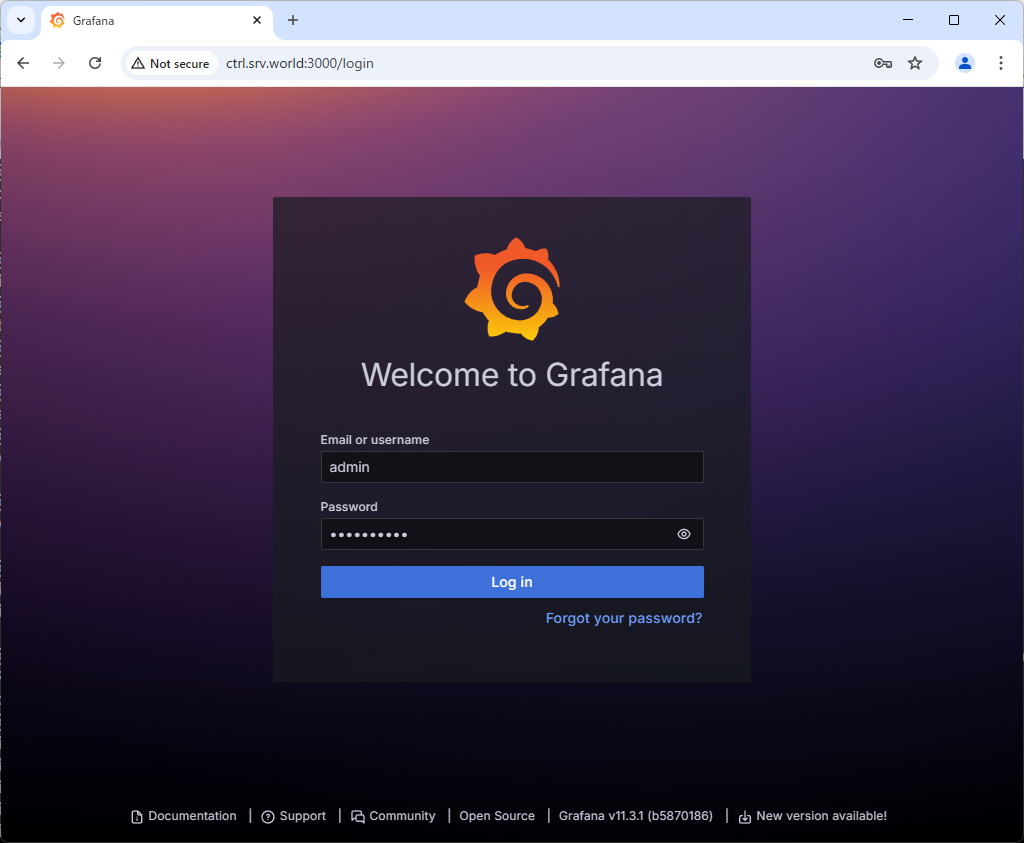
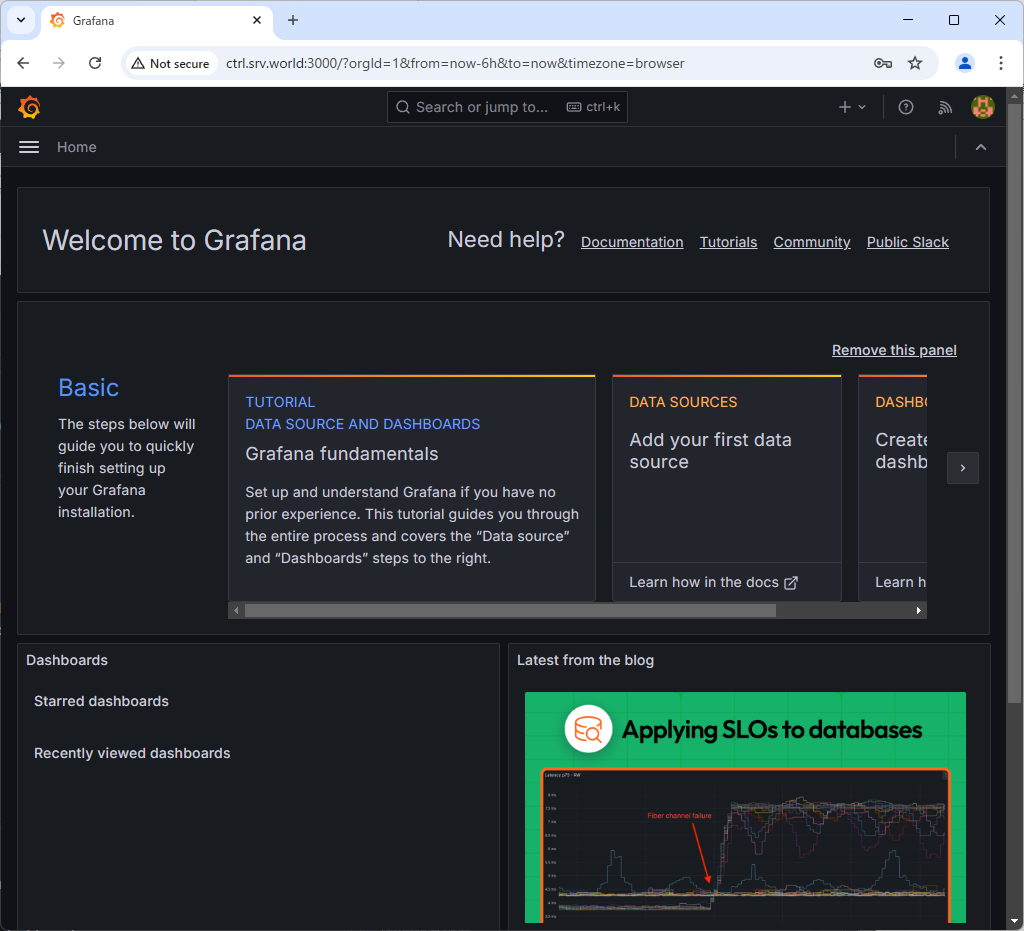
| [5] |
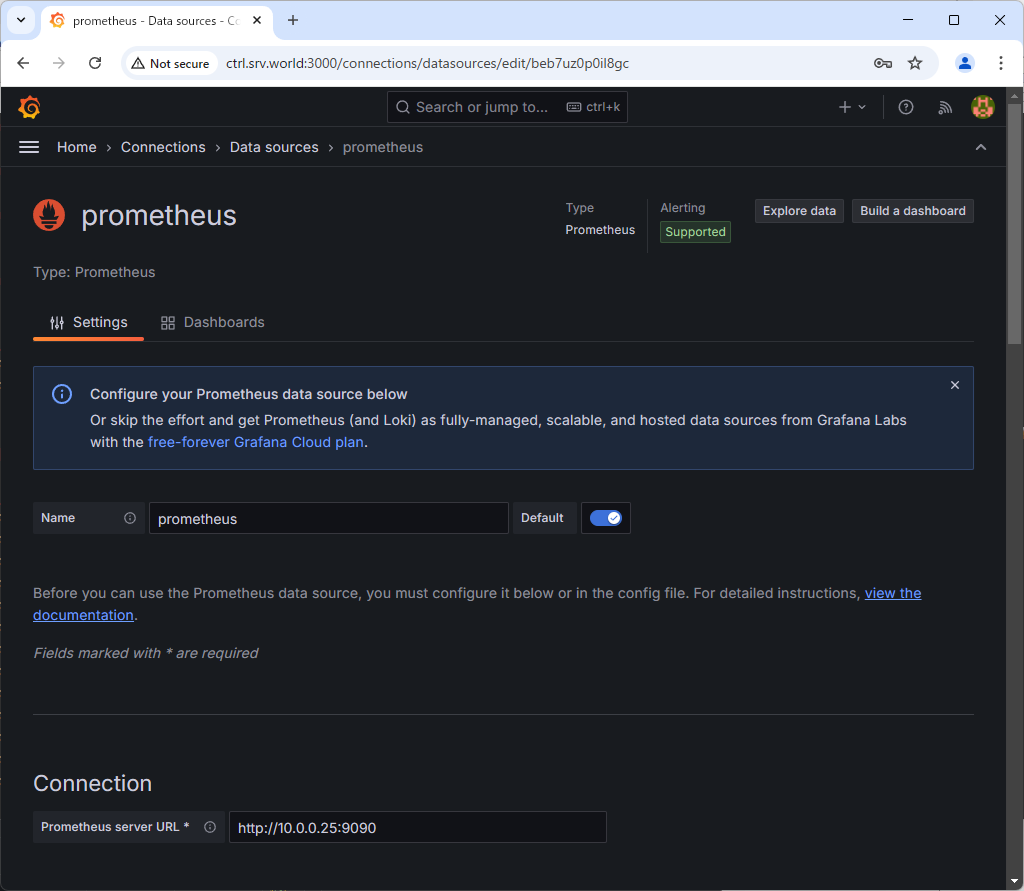
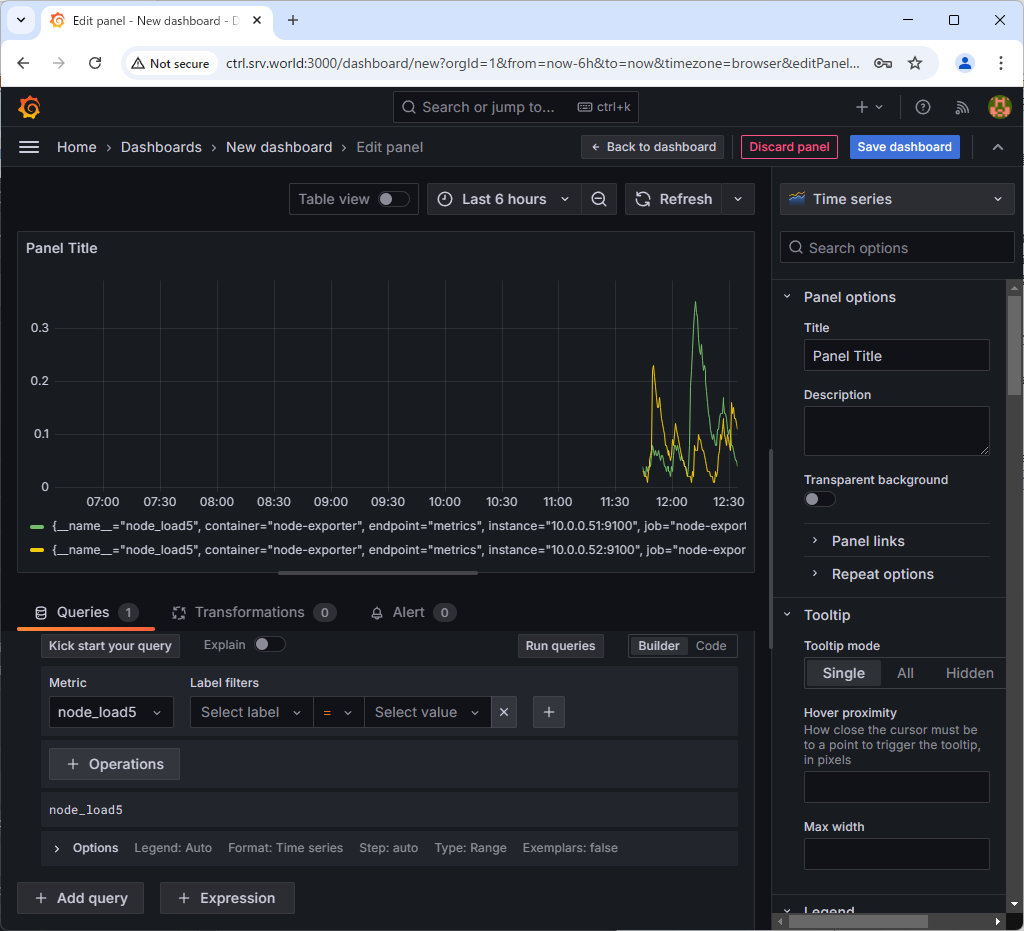
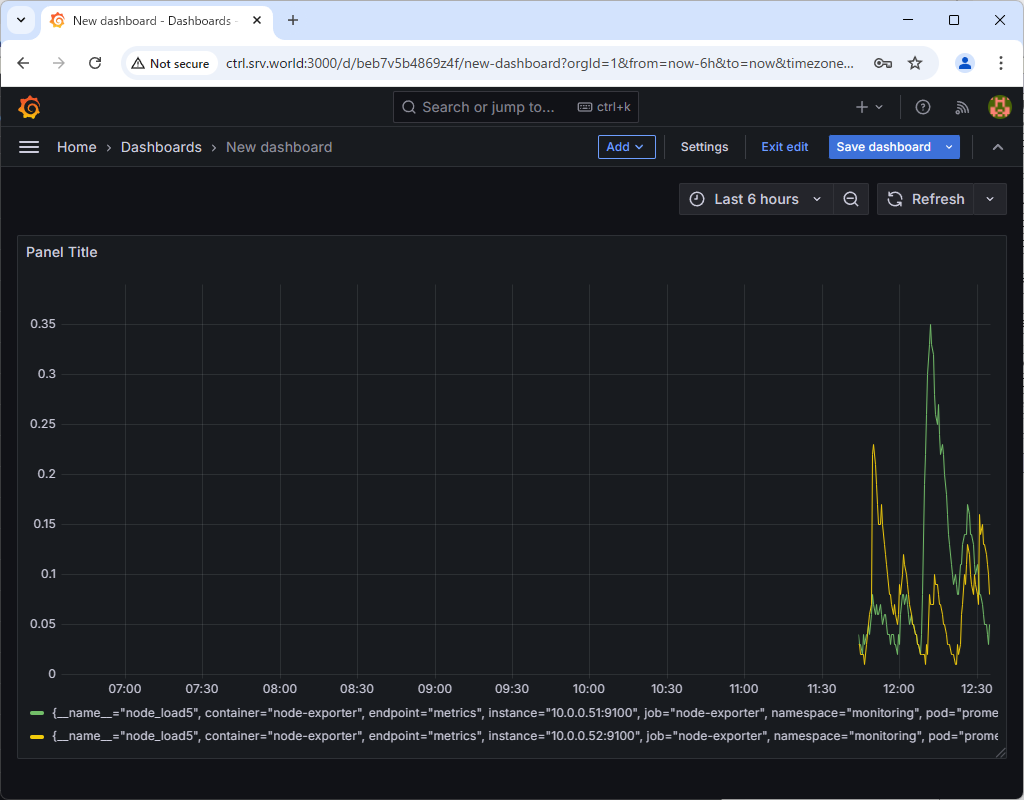
If you access to Grafana from a Host in cluster, access to the URL below with an Web browser. ⇒ http://grafana.monitoring.svc.cluster.local If you set port-forwarding, access to the URL below on a client computer in your local network. ⇒ http://(Manager Node Hostname or IP address):(setting port)/ That's OK if following Grafana UI is displayed. For [admin] password, it's possible to confirm with the command below.⇒ echo "Password: $(kubectl get secret grafana-admin --namespace monitoring -o jsonpath="{.data.GF_SECURITY_ADMIN_PASSWORD}" | base64 -d)" |
|
|
|
|
|