Prometheus : Add Monitoring Target (Windows)2024/09/06 |
|
If you want to add a Windows computer as a monitored node, configure it as follows. |
|
| [1] |
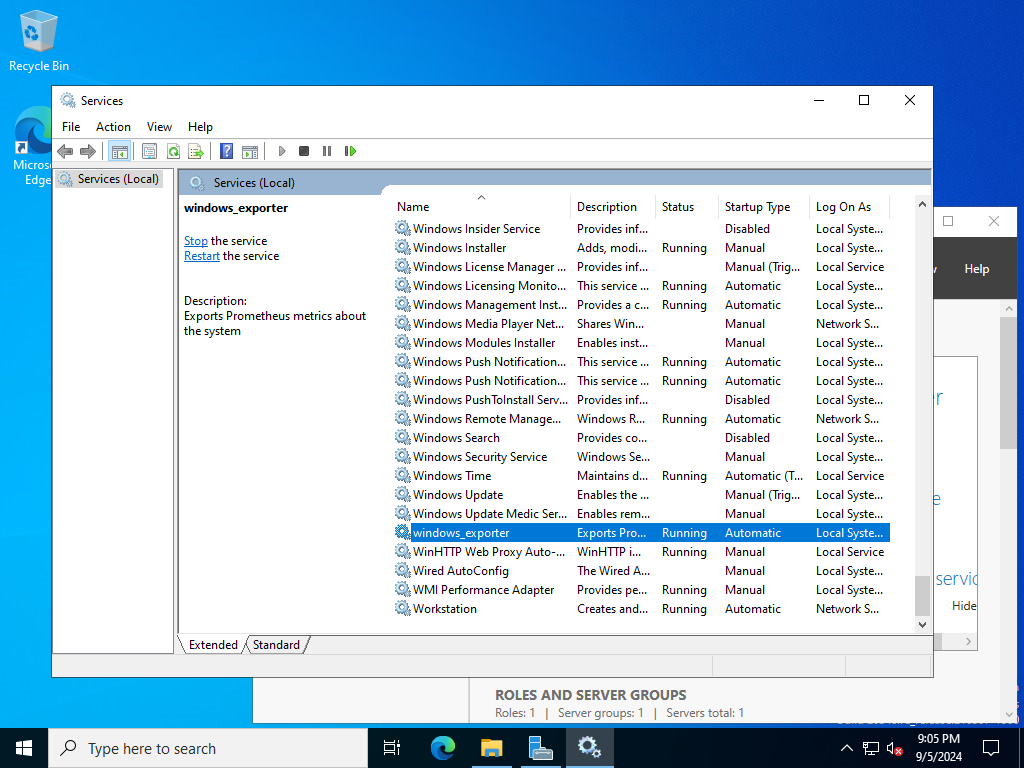
Install Windows exporter on the target Windows computer. ⇒ https://github.com/prometheus-community/windows_exporter/releases |
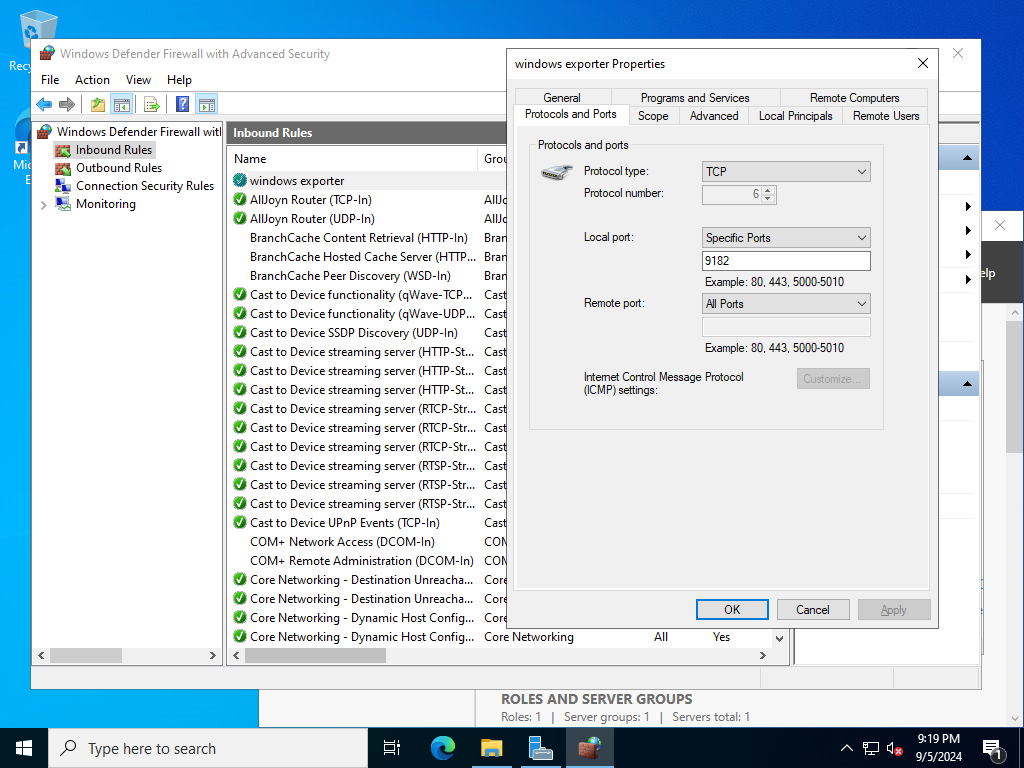
| [2] | After installed, [windows_exporter] will start and listen on port [9182]. An incoming rule will also be registered in Windows Firewall. (if not registred, allow 9182 manually) |
|
|
| [3] | Add setting on Prometheus Server Configuration. |
|
root@dlp:~ #
vi /usr/local/etc/prometheus.yml
.....
.....
scrape_configs:
  # The job name is added as a label `job=<job_name>` to any timeseries scraped from this config.
  - job_name: "prometheus"

    # metrics_path defaults to '/metrics'
    # scheme defaults to 'http'.
    scheme: https
    tls_config:
      cert_file: /usr/local/etc/server.crt
      key_file: /usr/local/etc/server.key
      insecure_skip_verify: true
    basic_auth:
      username: 'admin'
      password: 'password'

    static_configs:
      - targets: ["localhost:9090"]

  - job_name: node
    # add new Windows Host to [targets] line
    static_configs:
      - targets: ['localhost:9100', 'rx-7.srv.world:9182']

  # alternatively, if you'd like to add to another group,
  # add [job_name] section like follows
  # any name is OK for [job_name]
  - job_name: Windows
    static_configs:
      - targets: ['rx-7.srv.world:9182']
root@dlp:~ # service prometheus restart |
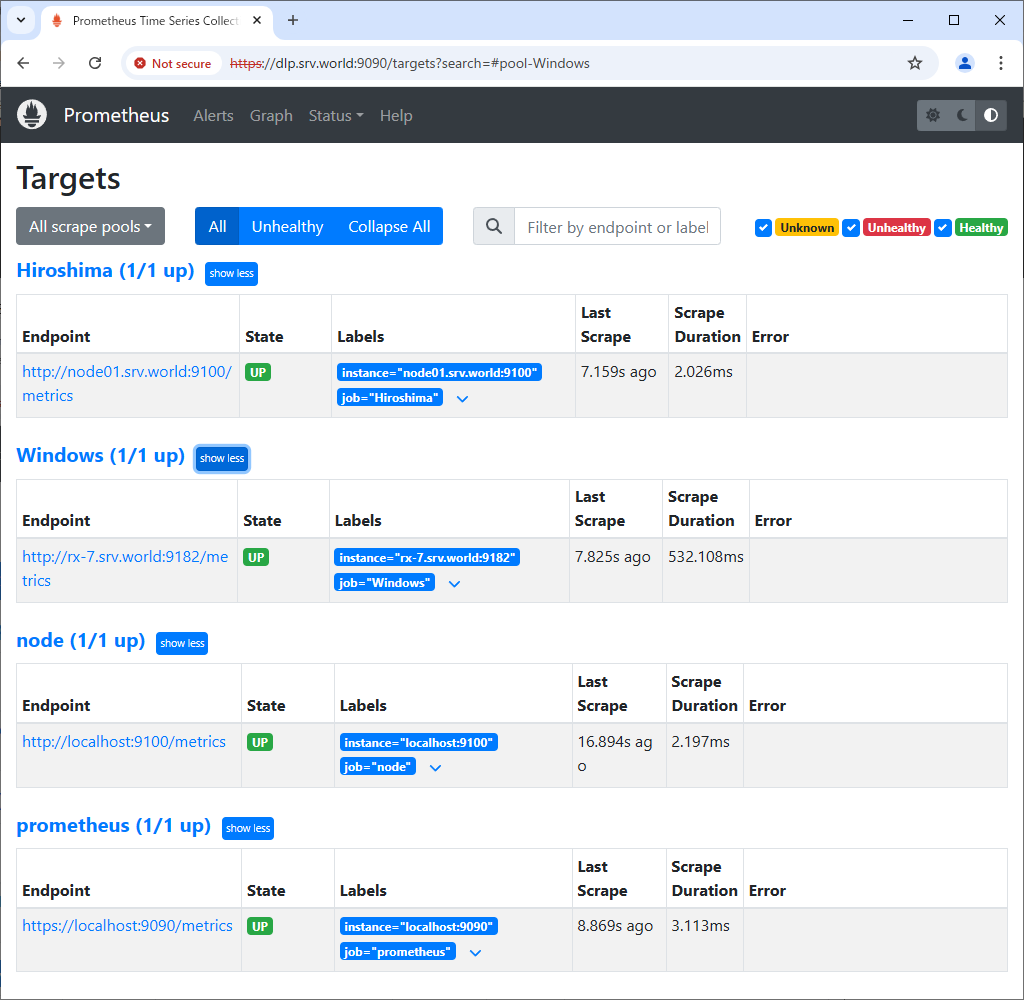
| [4] | Access to the Prometheus Web UI and click [Status] - [Targets] to verify new nodes are listed. |
|
|
|
Matched Content