Elastic Stack 8 : Install Auditbeat2024/08/02 |
|
Install Auditbeat that can monitor Audit actions. |
|
| [1] | Install Auditbeat. Configure Elasticsearch repository before it. |
|
root@dlp:~# apt -y install auditbeat
|
| [2] | Configure basic settings and start Auditbeat. |
|
root@dlp:~#
vi /etc/auditbeat/auditbeat.yml # line 13 : set Audit action (writing rules is the same with auditctl)
- module: auditd
  audit_rules: |
    ## Define audit rules here.
    ## Create file watches (-w) or syscall audits (-a or -A). Uncomment these
    ## examples or add your own rules.

    ## If you are on a 64 bit platform, everything should be running
    ## in 64 bit mode. This rule will detect any use of the 32 bit syscalls
    ## because this might be a sign of someone exploiting a hole in the 32
    ## bit API.
    #-a always,exit -F arch=b32 -S all -F key=32bit-abi

    ## Executions.
    #-a always,exit -F arch=b64 -S execve,execveat -k exec

    ## External access (warning: these can be expensive to audit).
    #-a always,exit -F arch=b64 -S accept,bind,connect -F key=external-access

    ## Identity changes.
    #-w /etc/group -p wa -k identity
    #-w /etc/passwd -p wa -k identity
    #-w /etc/gshadow -p wa -k identity

.....
.....
# line 122 : if use Kibana, uncomment and specify output host # if SSL is enabled on Kibana, hostname should be the same with the hostname in certs # [username] and [password] is the admin user's one # if using self-signed certificate, specify [ssl.verification_mode: none] setup.kibana: ..... host: "https://dlp.srv.world:5601" protocol: "https" username: "elastic" password: "password" ssl.enabled: true ssl.verification_mode: none # line 154 : specify output of Elasticsearch # [username] and [password] is the admin user's one # [ssl.certificate_authorities] is the cacert generated by Elasticsearch installation output.elasticsearch: # Array of hosts to connect to. hosts: ["https://dlp.srv.world:9200"] protocol: "https" #api_key: "id:api_key" username: "elastic" password: "password" ssl.certificate_authorities: "/etc/elasticsearch/certs/http_ca.crt" ..... .....
root@dlp:~#
vi /etc/auditbeat/auditbeat.reference.yml # line 34 : basic settings for auditd module - module: auditd resolve_ids: true failure_mode: silent backlog_limit: 8196 rate_limit: 0 include_raw_message: false include_warnings: false audit_rules: | ..... ..... # line 1460 : if use Kibana, uncomment and specify output host # if SSL is enabled on Kibana, uncomment ssl related lines # [username] and [password] is the admin user's one # if using self-signed certificate, specify [ssl.verification_mode: none] setup.kibana: # Kibana Host # Scheme and port can be left out and will be set to the default (http and 5601) # In case you specify and additional path, the scheme is required: http://localhost:5601/path # IPv6 addresses should always be defined as: https://[2001:db8::1]:5601 host: "https://dlp.srv.world:5601" # Optional protocol and basic auth credentials. protocol: "https" username: "elastic" password: "password" # Optional HTTP Path #path: "" # Use SSL settings for HTTPS. Default is true. ssl.enabled: true ..... ..... # after very careful consideration. It is primarily intended as a temporary # diagnostic mechanism when attempting to resolve TLS errors; its use in # production environments is strongly discouraged. # The default value is full. ssl.verification_mode: noneroot@dlp:~# systemctl enable --now auditbeat
|
| [3] | Verify status the data has been collected normally. |
|
# index list root@dlp:~# curl -u elastic --cacert /etc/elasticsearch/certs/http_ca.crt https://127.0.0.1:9200/_cat/indices?v health status index uuid pri rep docs.count docs.deleted store.size pri.store.size dataset.size green open .internal.alerts-transform.health.alerts-default-000001 3MDAnVqWRkC_ucXp_f-dRg 1 0 0 0 249b 249b 249b green open .internal.alerts-observability.logs.alerts-default-000001 virq6rX_TAadxqKMrIr4tQ 1 0 0 0 249b 249b 249b green open .internal.alerts-observability.uptime.alerts-default-000001 46XZFk5FRl28WLwbzBCRCw 1 0 0 0 249b 249b 249b yellow open .ds-auditbeat-8.14.3-2024.08.02-000001 knoq-r-XRm26hKdcV62PRA 1 1 2624 0 1.3mb 1.3mb 1.3mb green open .internal.alerts-ml.anomaly-detection.alerts-default-000001 03VHbmGgSIOuhotRgmO1Yw 1 0 0 0 249b 249b 249b green open .internal.alerts-observability.slo.alerts-default-000001 IaTLW9hYRIm8y1ikEzlN2g 1 0 0 0 249b 249b 249b green open .internal.alerts-default.alerts-default-000001 XpCXm0SYQa2o_uT14iMPyw 1 0 0 0 249b 249b 249b green open .internal.alerts-observability.apm.alerts-default-000001 0OrsLwbDRVWozBNNt1RAOA 1 0 0 0 249b 249b 249b green open .internal.alerts-observability.metrics.alerts-default-000001 yQqehuwnTN-ndP0O-YoqYg 1 0 0 0 249b 249b 249b green open .kibana-observability-ai-assistant-conversations-000001 ctEkgFQkTc-2Fec_91qYJA 1 0 0 0 249b 249b 249b green open .internal.alerts-ml.anomaly-detection-health.alerts-default-000001 34FcMwC0S26Gw6PQlsAgHA 1 0 0 0 249b 249b 249b green open .internal.alerts-observability.threshold.alerts-default-000001 b9DylGvaSp6Glf8y8lKITA 1 0 0 0 249b 249b 249b yellow open .ds-packetbeat-8.14.3-2024.08.02-000001 x32rSrQQSu6HYkyypcMQzA 1 1 4708 0 2.7mb 2.7mb 2.7mb green open .kibana-observability-ai-assistant-kb-000001 bde5sw2OTaO0TX18GPGY8Q 1 0 0 0 249b 249b 249b green open .internal.alerts-security.alerts-default-000001 09-NNzj9SBK7QC9yzpFreQ 1 0 0 0 249b 249b 249b yellow open test_index KB7PcAnESd6F8Gz4BJz7AA 1 1 1 0 6.5kb 6.5kb 6.5kb yellow open .ds-metricbeat-8.14.3-2024.08.02-000001 3QM_SeQkRZG-Um9Dopq9Iw 1 1 3291 0 6.9mb 6.9mb 6.9mb green open .internal.alerts-stack.alerts-default-000001 yh_lotA4Q0KsZAx4iIGNig 1 0 0 0 249b 249b 249b # document list on the index root@dlp:~# curl -u elastic --cacert /etc/elasticsearch/certs/http_ca.crt https://127.0.0.1:9200/.ds-auditbeat-8.14.3-2024.08.02-000001/_search?pretty
{
  "took" : 1,
  "timed_out" : false,
  "_shards" : {
    "total" : 1,
    "successful" : 1,
    "skipped" : 0,
    "failed" : 0
  },
  "hits" : {
    "total" : {
      "value" : 2783,
      "relation" : "eq"
    },
    "max_score" : 1.0,
    "hits" : [
      {
        "_index" : ".ds-auditbeat-8.14.3-2024.08.02-000001",
        "_id" : "JrHQEJEBh42v6JiL2BPw",
        "_score" : 1.0,
        "_source" : {
          "@timestamp" : "2024-08-02T01:59:58.160Z",
          "event" : {
            "dataset" : "socket",
            "kind" : "event",
            "type" : [
              "info",
              "connection"
            ],
.....
.....
|
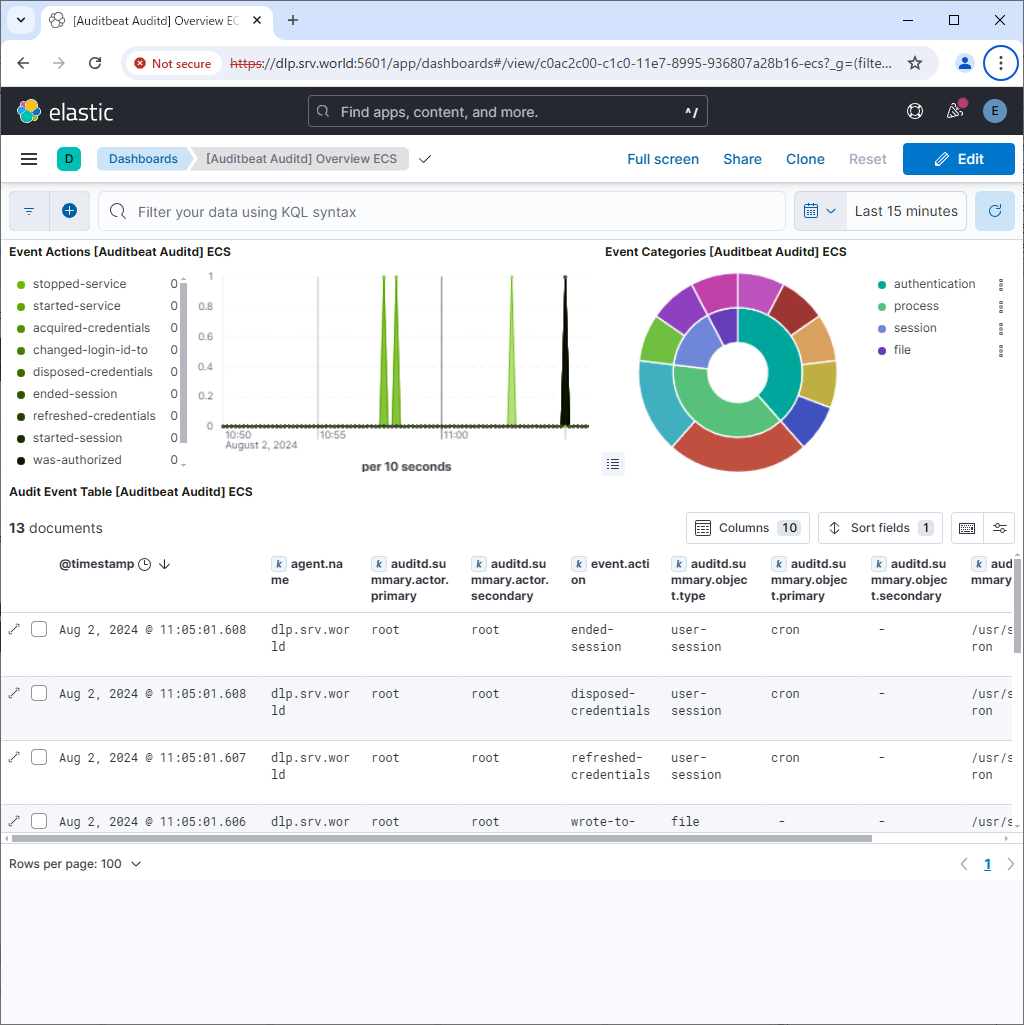
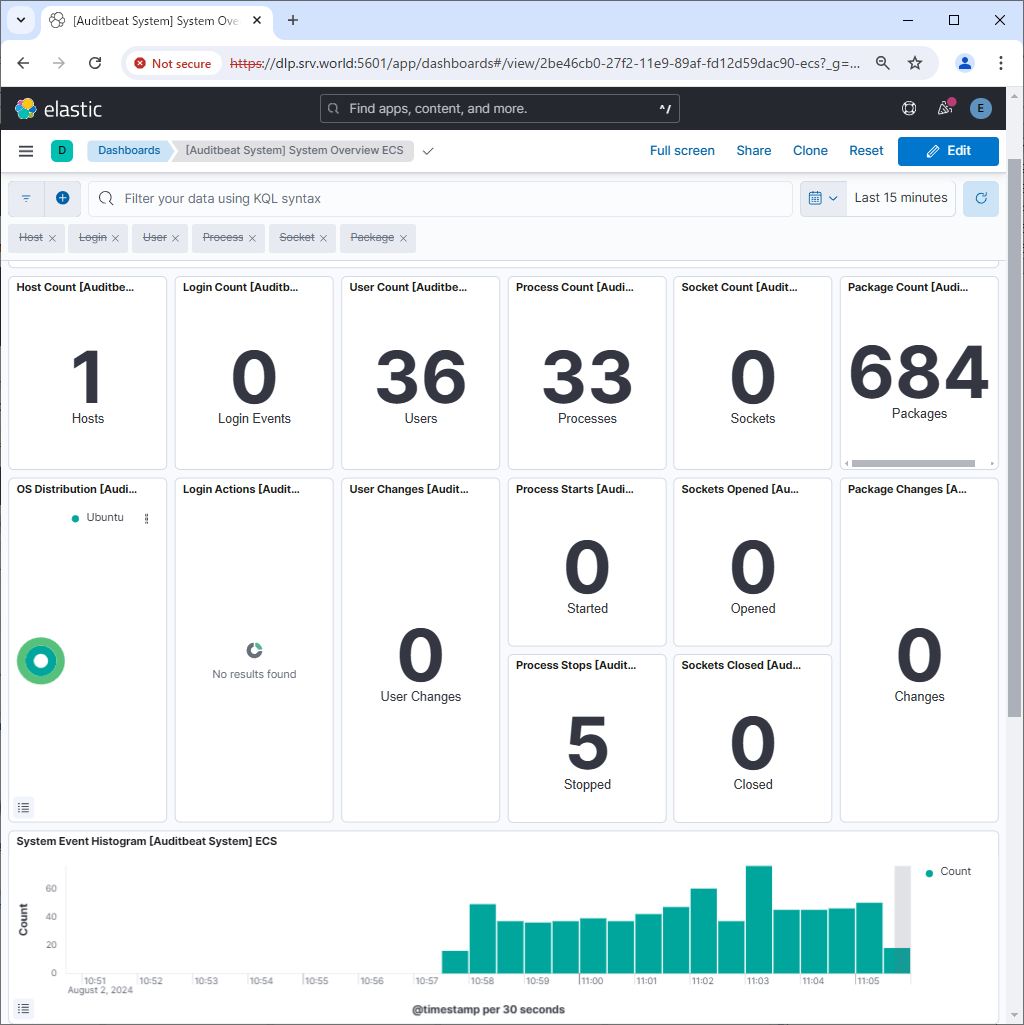
| [4] | If Kibana is running, it's possible to import data to sample Dashboards. |
|
root@dlp:~# auditbeat setup --dashboards Loading dashboards (Kibana must be running and reachable) Loaded dashboards |
|
|
Matched Content