Prometheus : Visualize on Grafana2024/06/12 |
|
Web UI is included in Prometheus but it's also possible to visualize time series data on Grafana.
|
|
| [1] |
Install Grafana, refer to here.
It's OK to install it on any Node. (install it on Prometheus server Node on this example) |
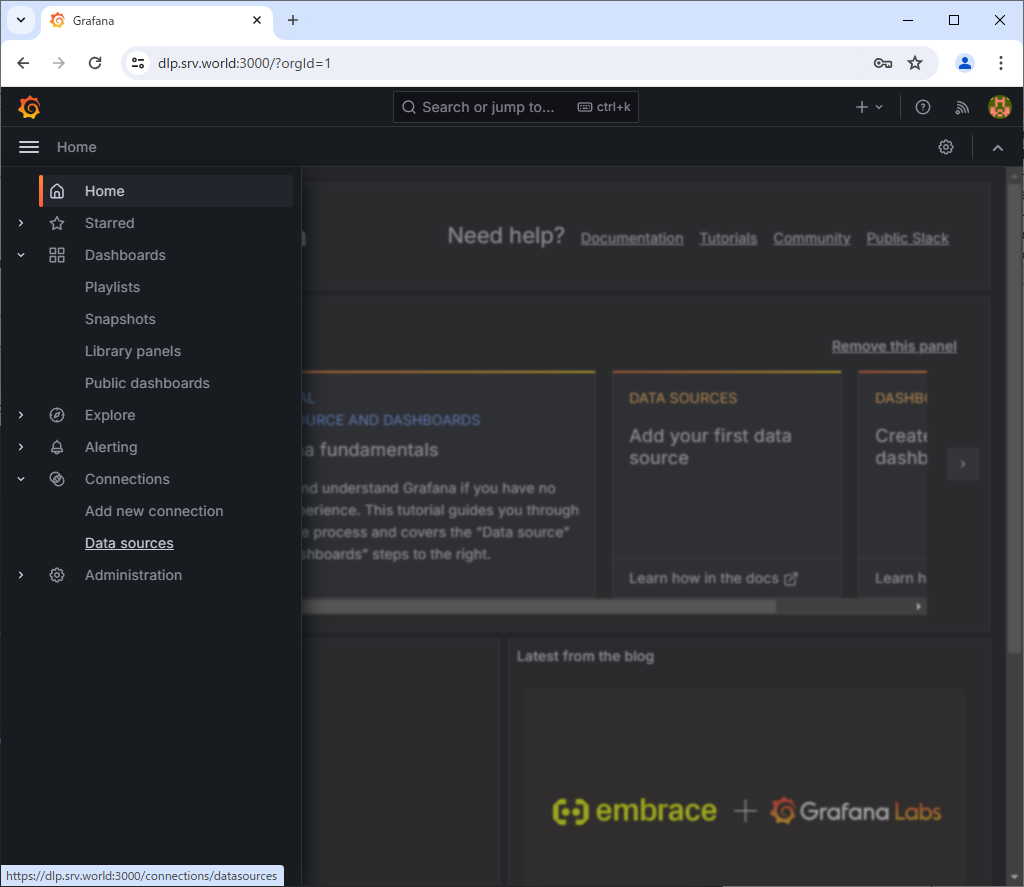
| [2] | Access to Grafana Dashboard and Open [Connections] - [Data Sources] on the left menu. |
|
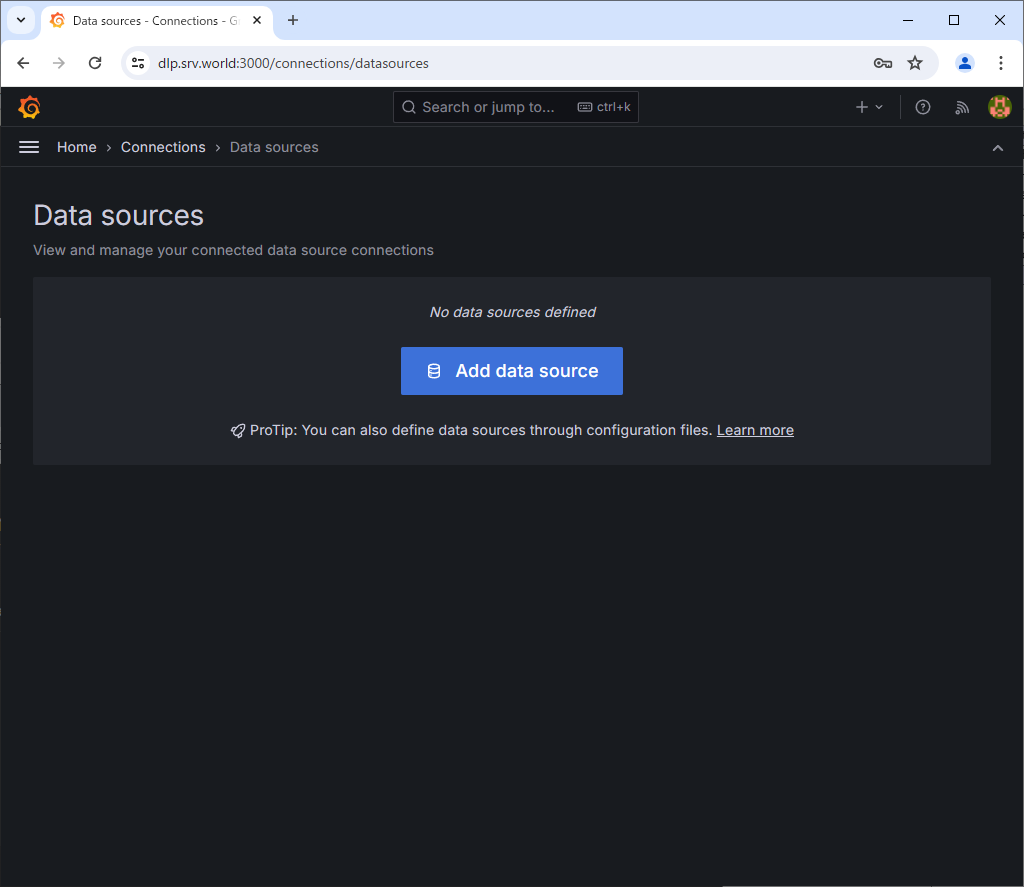
| [3] | Click [Add data source]. |
|
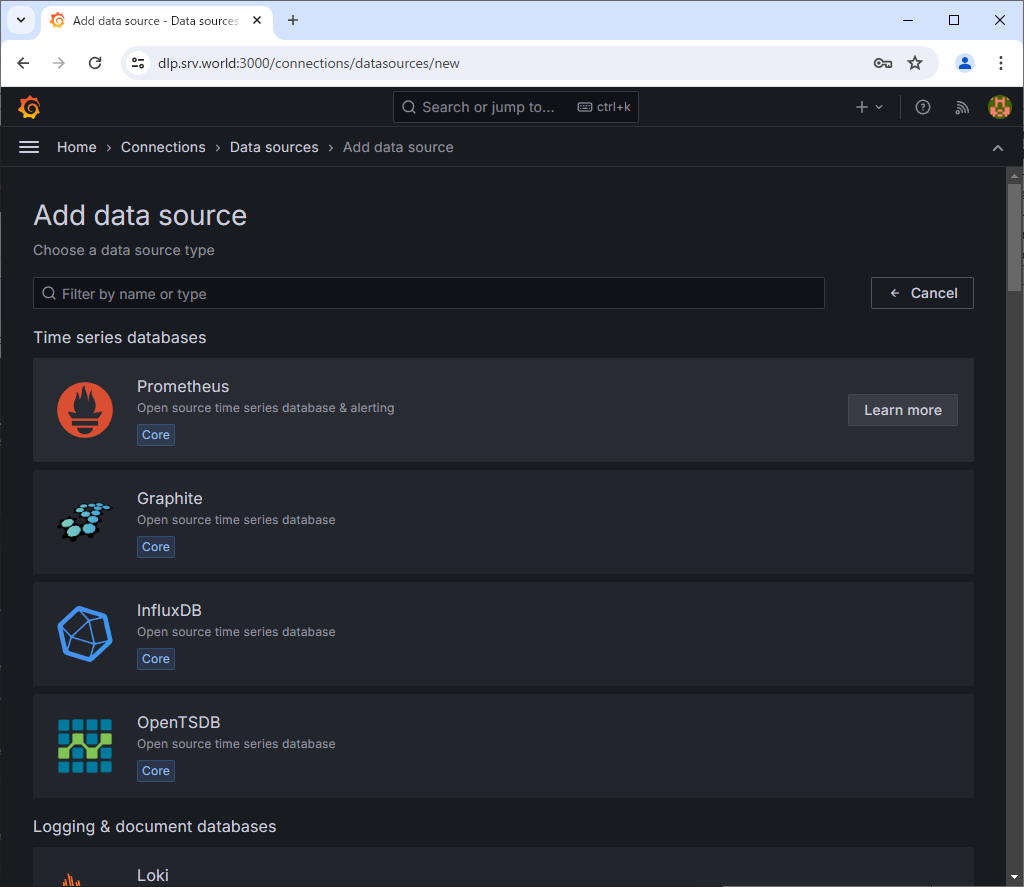
| [4] | Click [Prometheus]. |
|
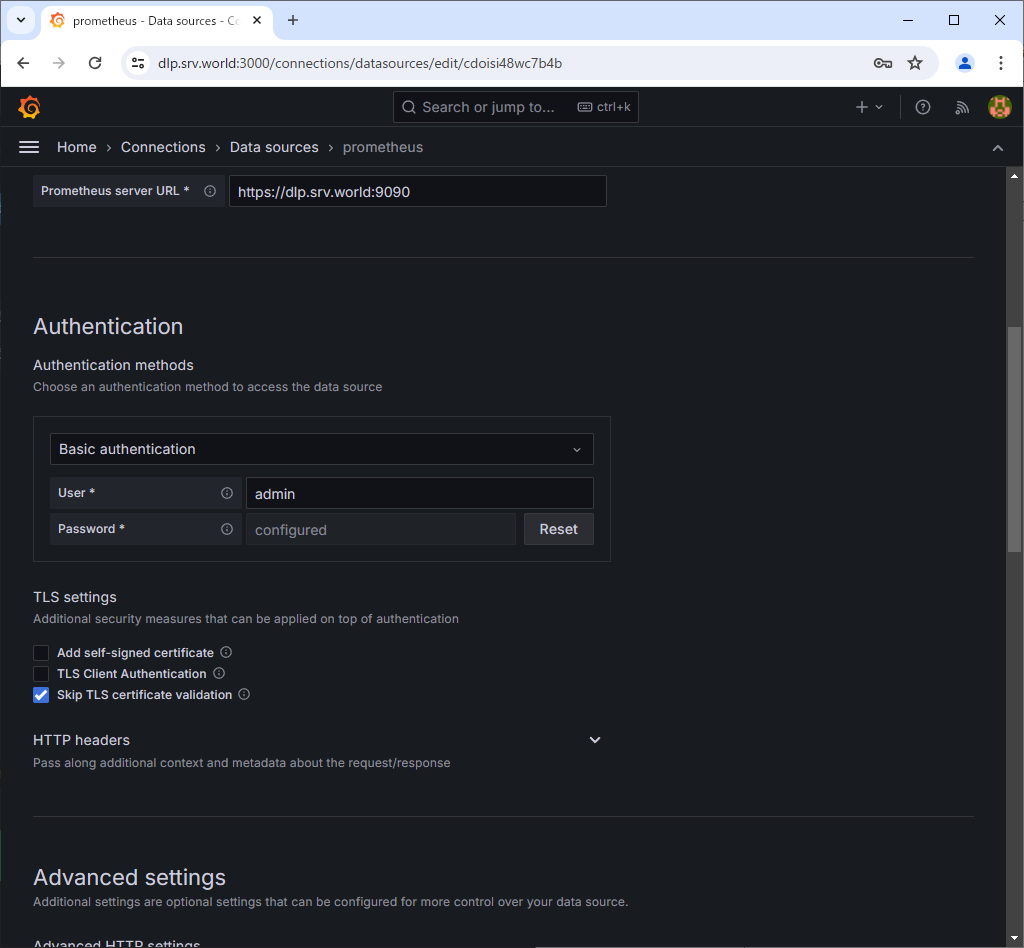
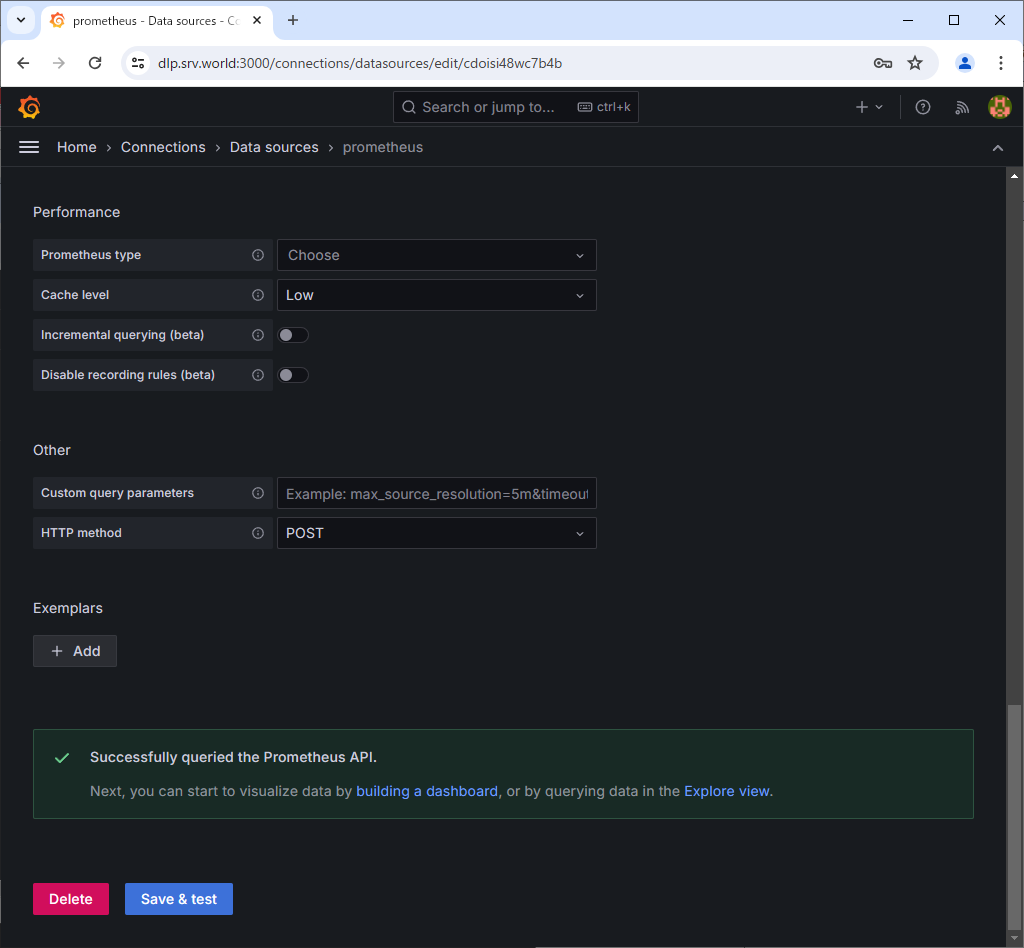
| [5] | Enter the endpoint URL of your Prometheus server in the URL field and click the Save & Test button at the bottom of the screen. If you have enabled authentication or HTTPS, configure the necessary settings accordingly. If there are no problems, you will see the message [Successfully queried the prometheus API]. |
|
|
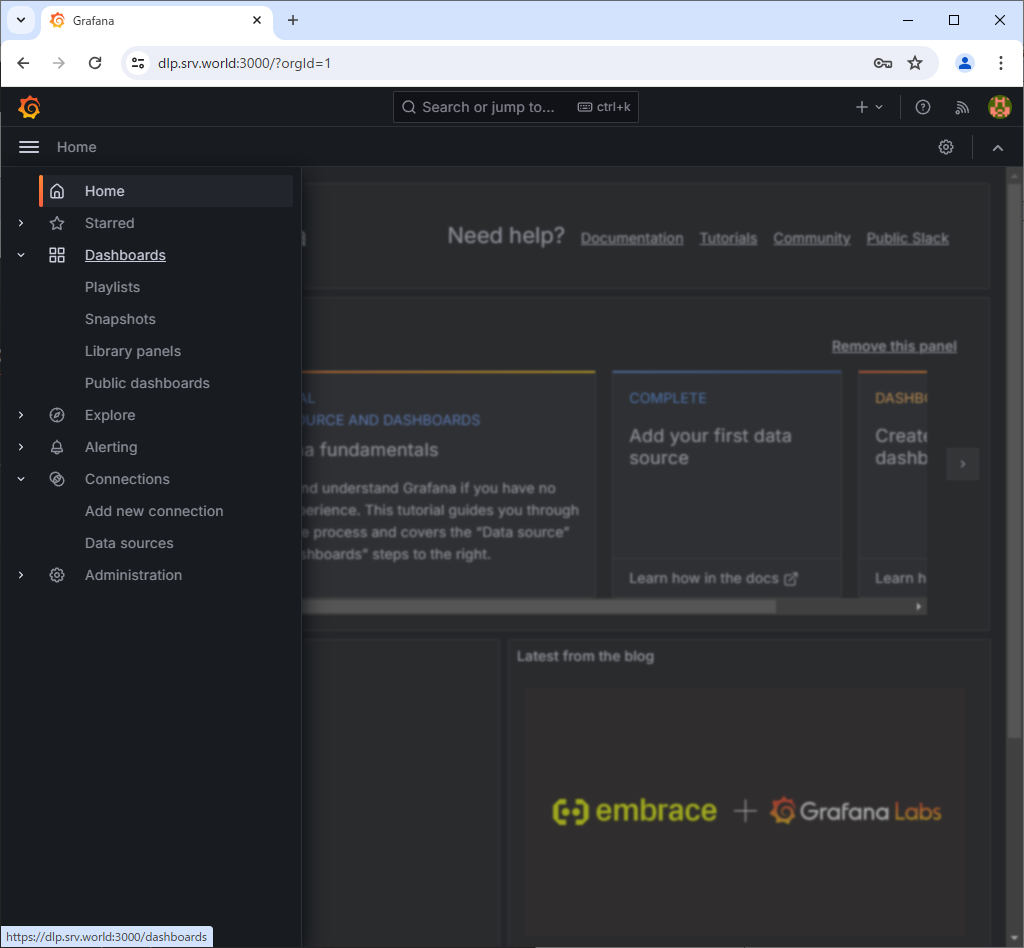
| [6] | Next, Click [Dashboard] on the left menu. |
|
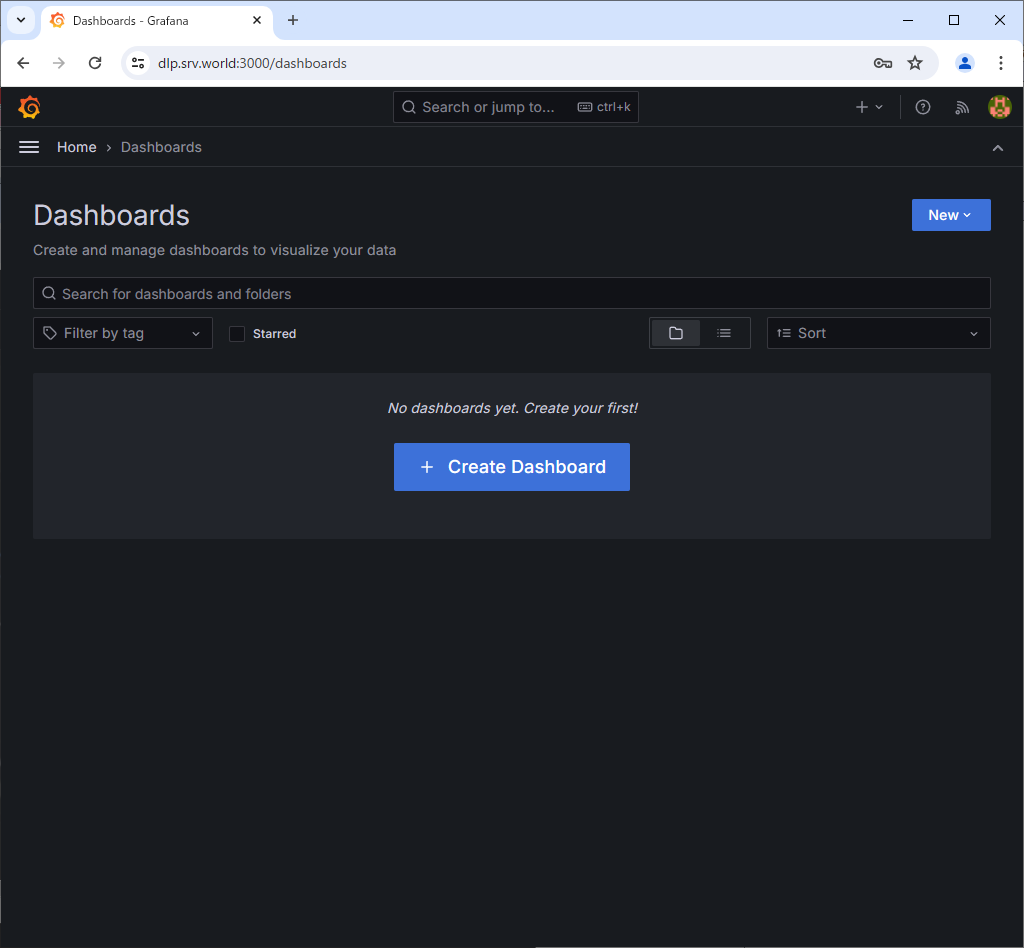
| [7] | Click [Create Dashboard]. |
|
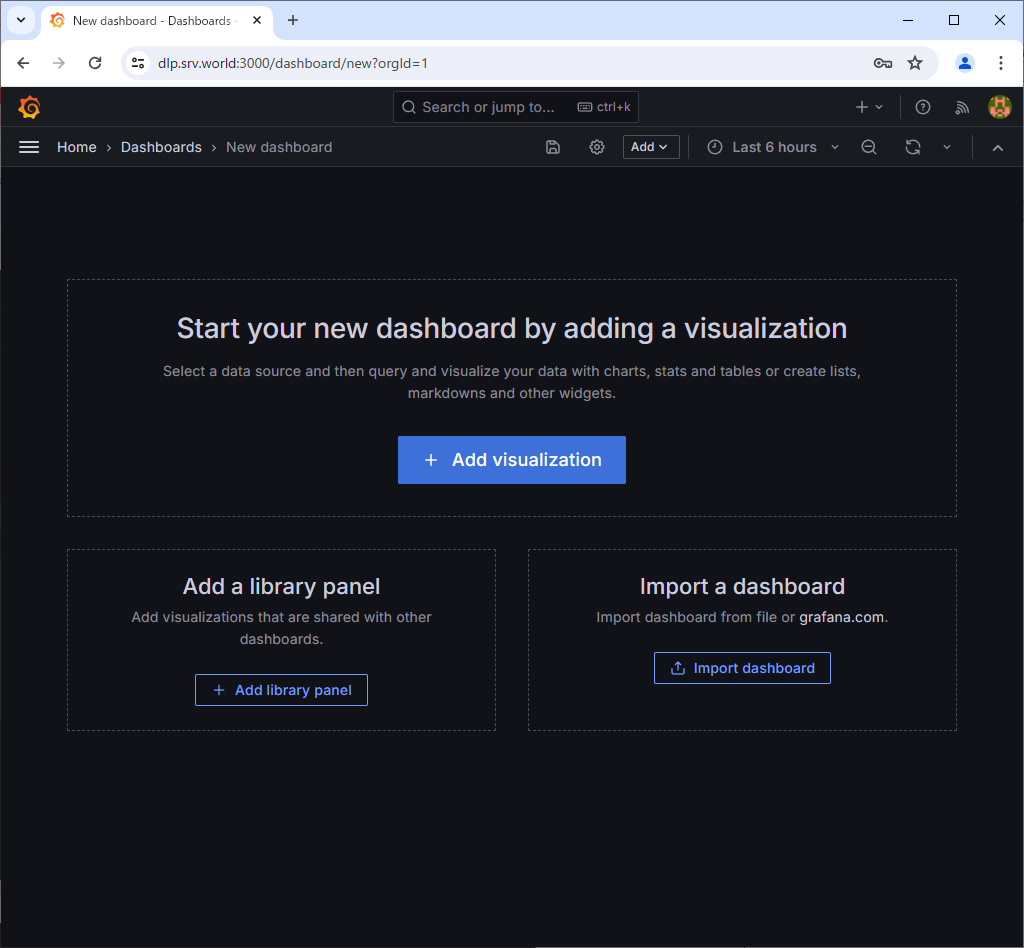
| [8] | Click [Add visualization]. |
|
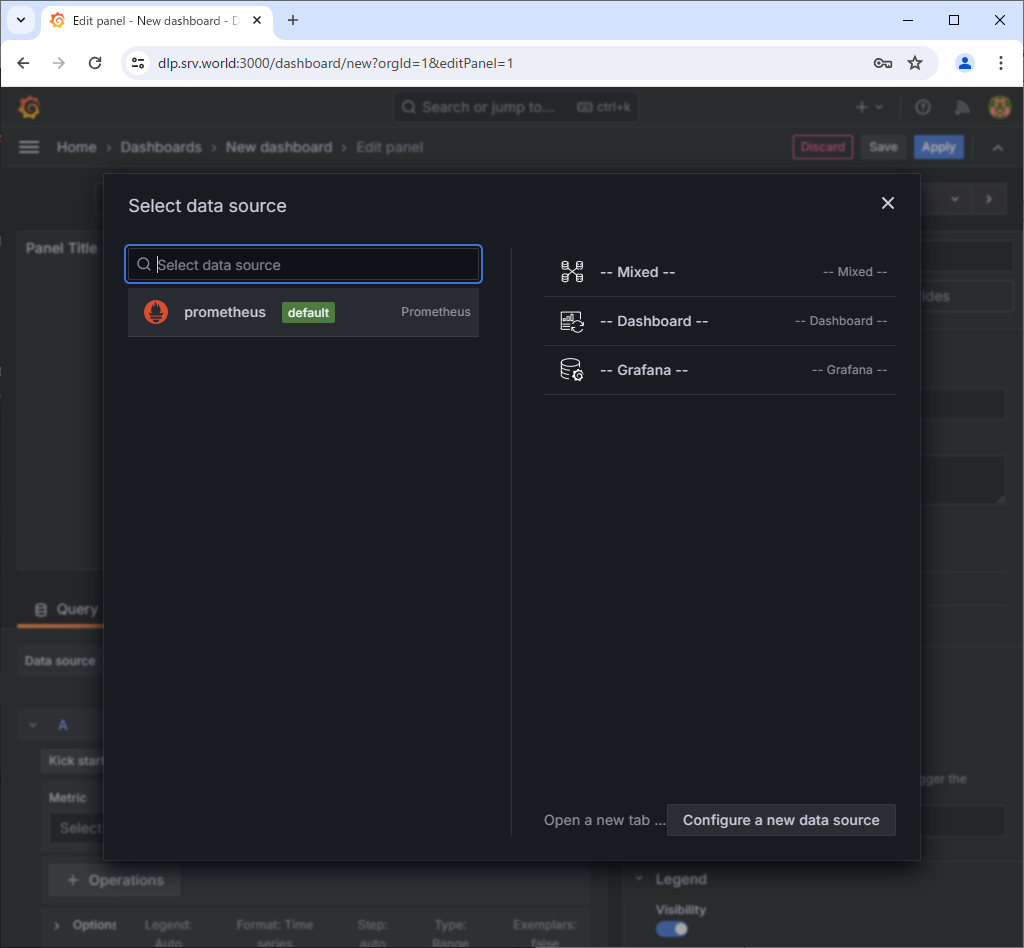
| [9] | Click [Prometheus]. |
|
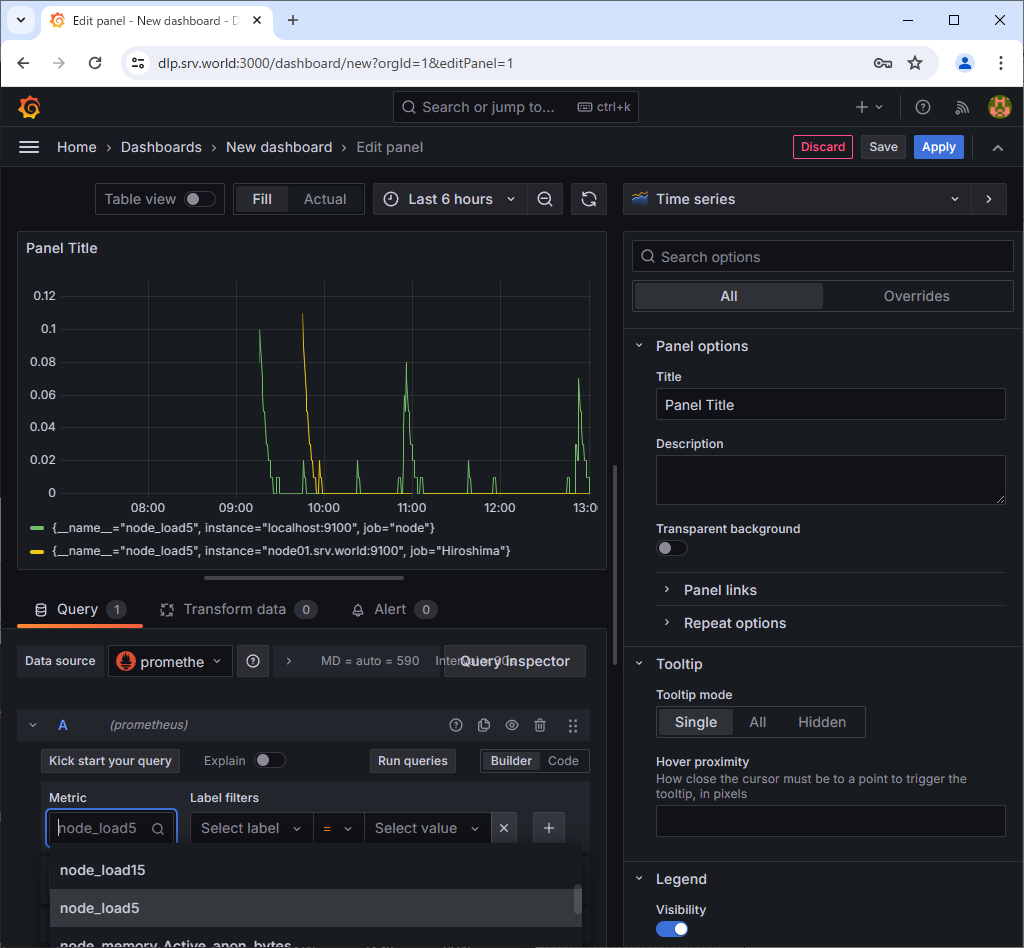
| [10] | From the Metrics field, select the query for the data you want to graph. Once you select a query, it will be graphed. To save the Dashboard, click the Save button at the top. |
|
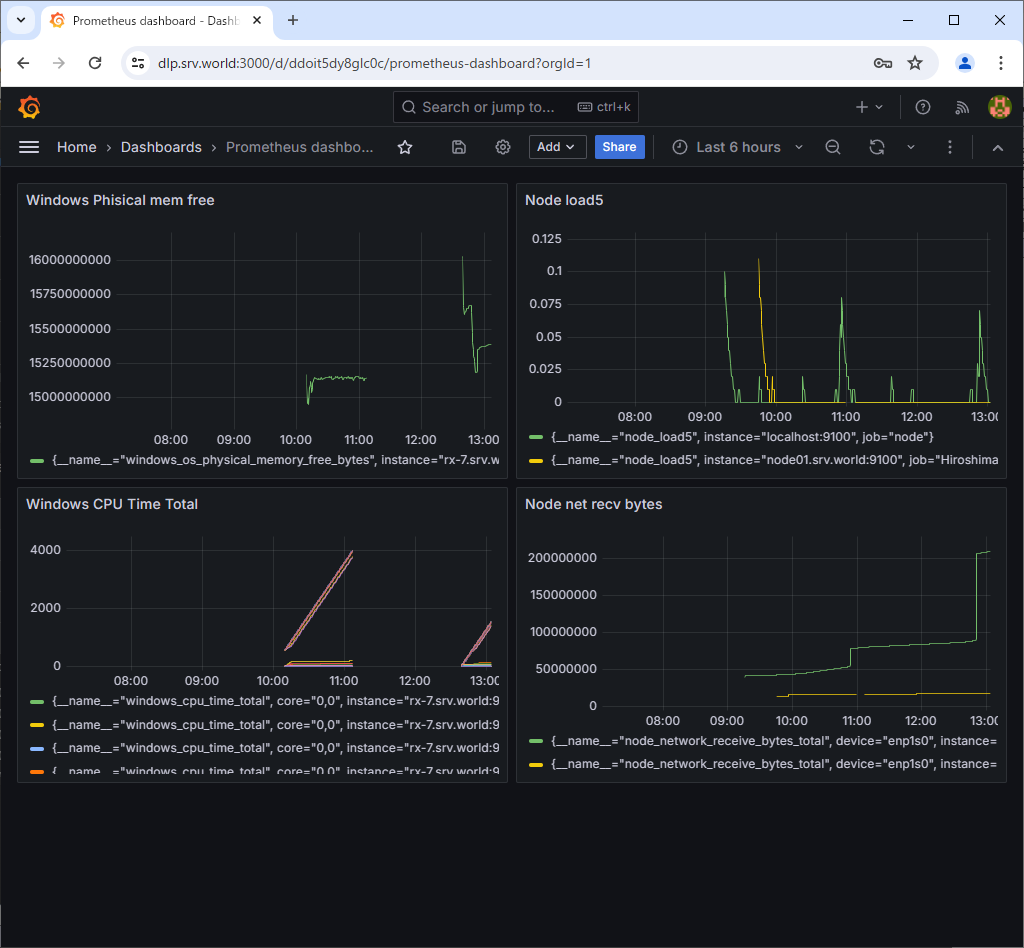
| [11] | By adding queries, it is also possible to display multiple graphs on one screen. |
|
Matched Content