MicroK8s : Enable Prometheus2022/07/28 |
|
Enable Prometheus add-on to monitor metrics on MicroK8s Cluster.
|
| [1] | Enable built-in Prometheus add-on on primary Node. |
|
[root@dlp ~]# microk8s enable prometheus dashboard dns Infer repository core for addon prometheus Infer repository core for addon dashboard Infer repository core for addon dns Infer repository core for addon dns Addon core/dns is already enabled ..... ..... service/prometheus-k8s created serviceaccount/prometheus-k8s created servicemonitor.monitoring.coreos.com/prometheus-k8s created The Prometheus operator is enabled (user/pass: admin/admin) Addon core/dashboard is already enabled Addon core/dns is already enabled[root@dlp ~]# microk8s kubectl get services -n monitoring NAME TYPE CLUSTER-IP EXTERNAL-IP PORT(S) AGE prometheus-operator ClusterIP None <none> 8443/TCP 24s alertmanager-main ClusterIP 10.152.183.40 <none> 9093/TCP 20s blackbox-exporter ClusterIP 10.152.183.152 <none> 9115/TCP,19115/TCP 20s grafana ClusterIP 10.152.183.102 <none> 3000/TCP 19s kube-state-metrics ClusterIP None <none> 8443/TCP,9443/TCP 19s node-exporter ClusterIP None <none> 9100/TCP 19s prometheus-adapter ClusterIP 10.152.183.13 <none> 443/TCP 19s prometheus-k8s ClusterIP 10.152.183.78 <none> 9090/TCP 18s[root@dlp ~]# microk8s kubectl get pods -n monitoring NAME READY STATUS RESTARTS AGE prometheus-adapter-85455b9f55-vw5tb 1/1 Running 0 4m22s prometheus-adapter-85455b9f55-d6h72 1/1 Running 0 4m22s grafana-789464df6b-8w4sl 1/1 Running 0 4m22s node-exporter-8gv6d 2/2 Running 0 4m22s kube-state-metrics-55b87f58f6-6nlwr 3/3 Running 0 4m22s prometheus-operator-65cdb77c59-ngsdp 2/2 Running 0 4m22s blackbox-exporter-84c68b59b8-mgrmc 3/3 Running 0 4m22s alertmanager-main-0 2/2 Running 0 3m27s prometheus-k8s-0 2/2 Running 1 (2m2s ago) 3m26s # set port-forwarding to enable external access # Prometheus UI [root@dlp ~]# microk8s kubectl port-forward -n monitoring service/prometheus-k8s --address 0.0.0.0 9090:9090 Forwarding from 0.0.0.0:9090 -> 9090 # Grafana UI [root@dlp ~]# microk8s kubectl port-forward -n monitoring service/grafana --address 0.0.0.0 3000:3000 Forwarding from 0.0.0.0:3000 -> 3000 # if Firewalld is running, allow ports [root@dlp ~]# firewall-cmd --add-port={9090/tcp,3000/tcp} [root@dlp ~]# firewall-cmd --runtime-to-permanent |
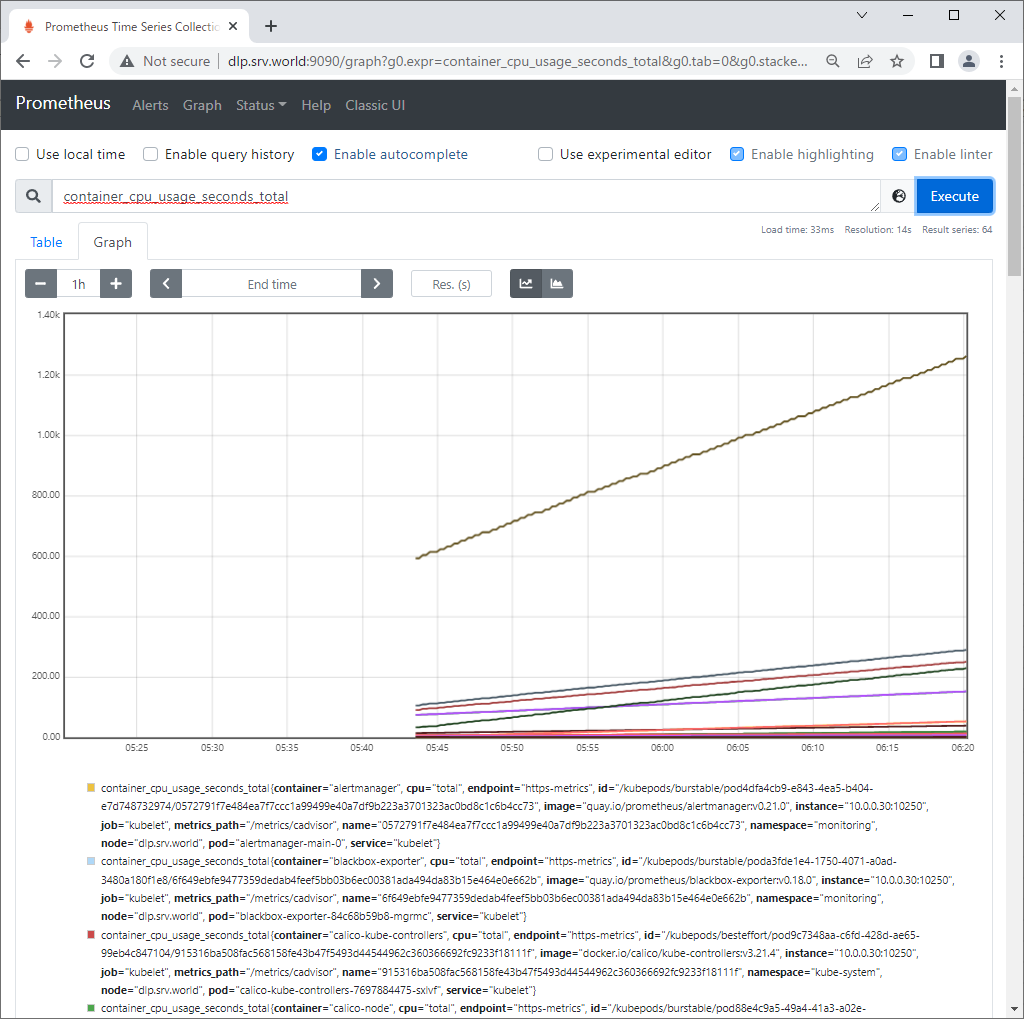
| [2] | Access to [https://(MicroK8s primary node's Hostname or IP address):(setting port)] with an web browser
on a Client computer in local network. Then, that's OK if following Prometheus or Grafana UI is shown. For default user/password on Grafana, it [admin/admin]. |

|

|

|
Matched Content