Grafana : Install2025/01/06 |
|
Install Web Dashboard tool, Grafana.
Grafana is the visualize tool, so it needs data source from Database System like |
|
| [1] | Install Grafana. |
|
[root@dlp ~]#
dnf -y install grafana
[root@dlp ~]#
vi /etc/grafana/grafana.ini # line 36 : uncoment and specify protocol ⇒ possible to change to [https], [h2], [socket] ;protocol = http # line 42 : if you limit access to Grafana, uncomment and set specific IP address Grafana listens # listen all [0.0.0.0] by default ;http_addr = # line 45 : specify port ⇒ possible to change to other port ;http_port = 3000 # line 48 : specify domain name ⇒ possible to change to your domain name ;domain = localhost # line 71,72 : specify your certificate if you set [https] or [h2] for protocol # * it needs [grafana] user can read certificate and key cert_file = /etc/letsencrypt/live/dlp.srv.world/fullchain.pem cert_key = /etc/letsencrypt/live/dlp.srv.world/privkey.pem[root@dlp ~]# systemctl enable --now grafana-server
|
| [2] | If Firewalld is running, allow service ports. |
|
[root@dlp ~]# firewall-cmd --add-port=3000/tcp success [root@dlp ~]# firewall-cmd --runtime-to-permanent success |
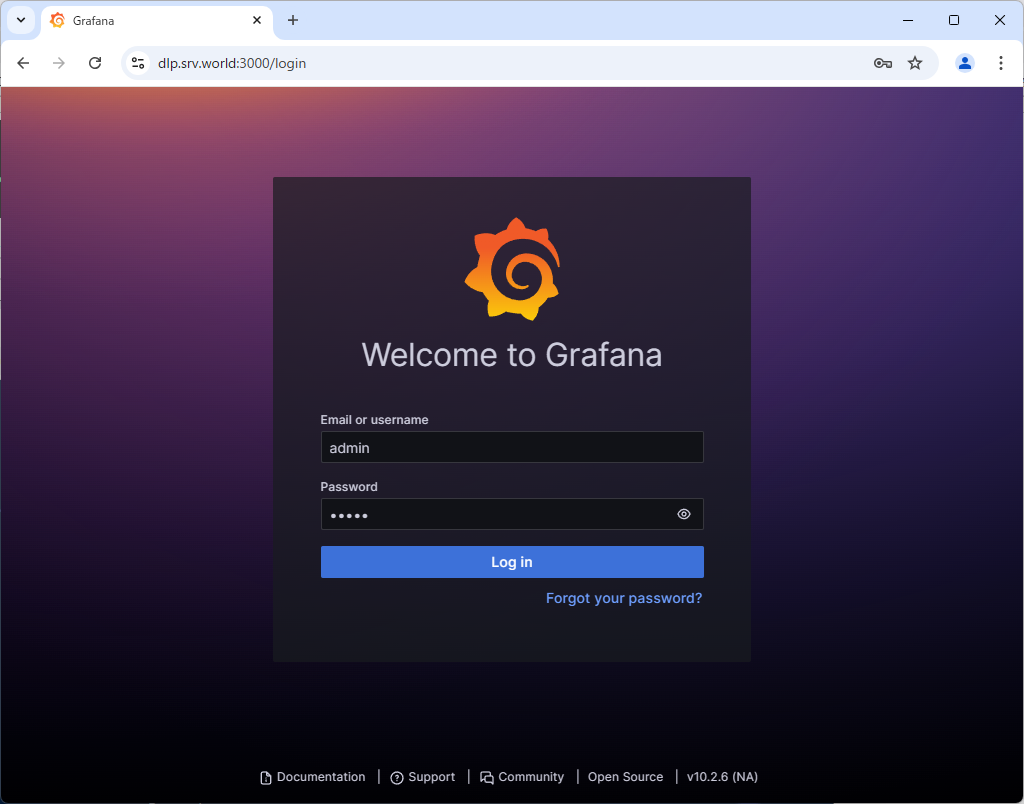
| [3] | Access to [http://(Grafana server's hostname or IP address):3000/] from any Clients with web browser, then, Grafana login form is shown like follows. It's possible to login with [admin] user and with the default password [admin]. |
|
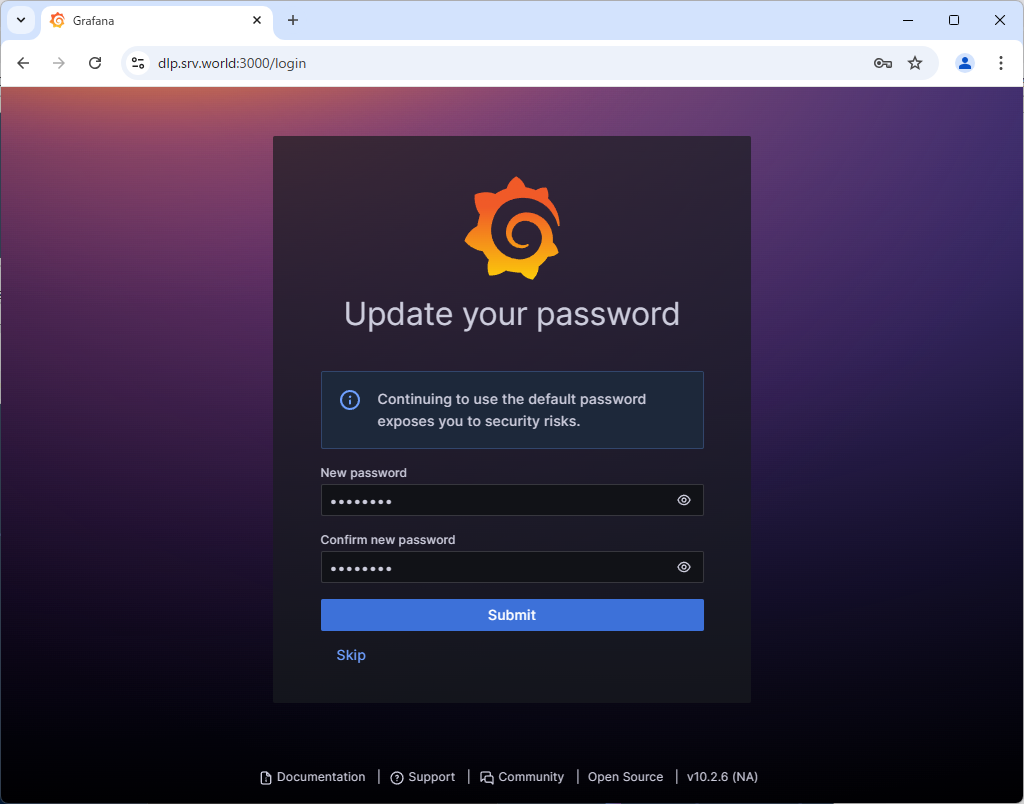
| [4] | When initial login, it needs to change admin password. Set any one and Click [Submit] button. |
|
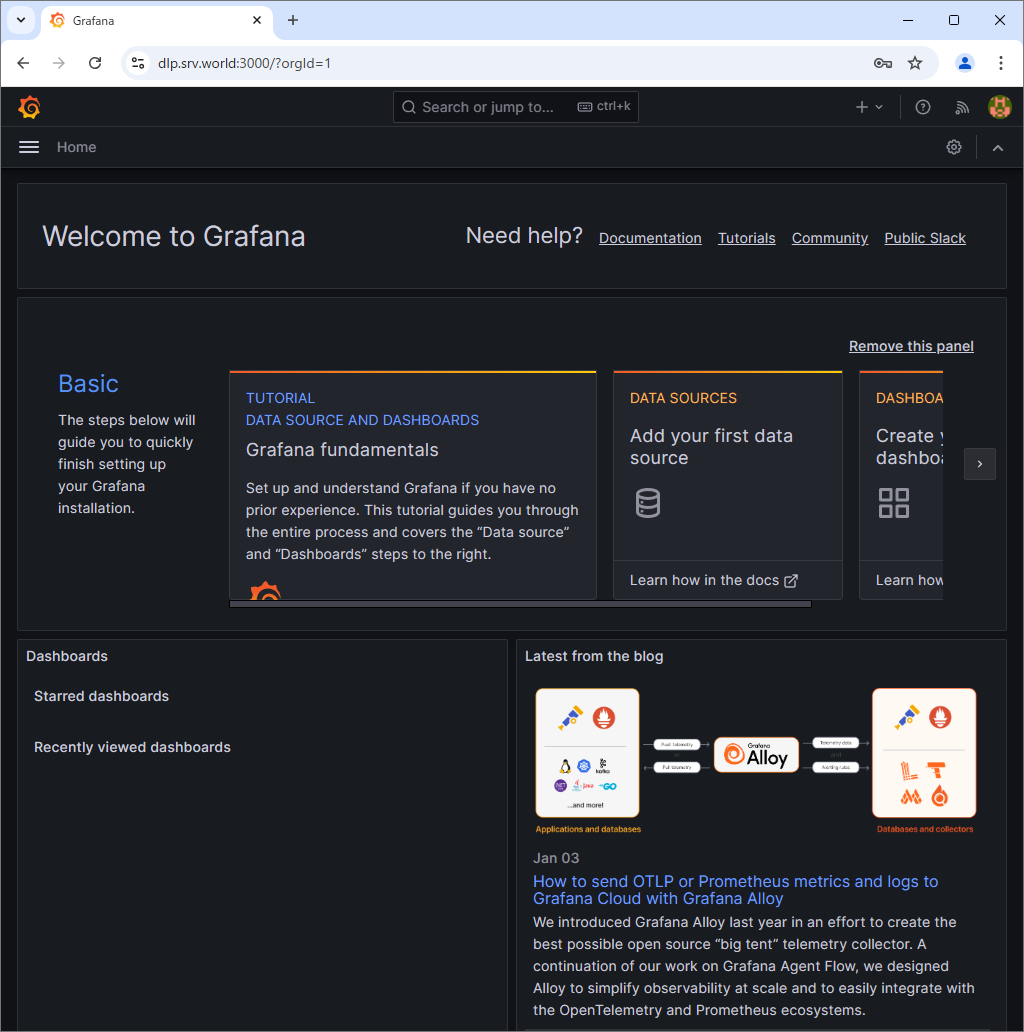
| [5] | After login normally, Grafana Home is shown. |
|
Matched Content