Prometheus : स्थापित करना2023/09/15 |
|
सिस्टम मॉनिटरिंग और अलर्टिंग टूलकिट [Prometheus] स्थापित करें।
नीचे आधिकारिक साइट पर Prometheus के बारे में अवलोकन जानें।
⇒ https://prometheus.io/docs/introduction/overview/
|
|
| [1] | Prometheus सर्वर इंस्टॉल करें और [node-exporter] भी इंस्टॉल करें जिसमें सिस्टम पर सीपीयू या मेमोरी उपयोग जैसे सामान्य संसाधन का मीट्रिक डेटा प्राप्त करने की सुविधाएं शामिल हैं। |
|
root@dlp:~# apt -y install prometheus prometheus-node-exporter
|
| [2] | [prometheus.yml] पर बुनियादी सेटिंग्स कॉन्फ़िगर करें। |
|
# डिफ़ॉल्ट सेटिंग इस प्रकार है # डिफ़ॉल्ट रखते हुए भी, [Prometheus] लोकलहोस्ट पर सर्वर संबंधी मेट्रिक्स एकत्र किए जाते हैं root@dlp:~# vi /etc/prometheus/prometheus.yml
# Sample config for Prometheus.

global:
  scrape_interval:     15s # Set the scrape interval to every 15 seconds. Default is every 1 minute.
  evaluation_interval: 15s # Evaluate rules every 15 seconds. The default is every 1 minute.
  # scrape_timeout is set to the global default (10s).

  # Attach these labels to any time series or alerts when communicating with
  # external systems (federation, remote storage, Alertmanager).
  external_labels:
      monitor: 'example'

# Alertmanager configuration
alerting:
  alertmanagers:
  - static_configs:
    - targets: ['localhost:9093']

# Load rules once and periodically evaluate them according to the global 'evaluation_interval'.
rule_files:
  # - "first_rules.yml"
  # - "second_rules.yml"

# A scrape configuration containing exactly one endpoint to scrape:
# Here it's Prometheus itself.
scrape_configs:
  # The job name is added as a label `job=<job_name>` to any timeseries scraped from this config.
  - job_name: 'prometheus'

    # Override the global default and scrape targets from this job every 5 seconds.
    scrape_interval: 5s
    scrape_timeout: 5s

    # metrics_path defaults to '/metrics'
    # scheme defaults to 'http'.

    static_configs:
      - targets: ['localhost:9090']

  - job_name: node
    # If prometheus-node-exporter is installed, grab stats about the local
    # machine by default.
    static_configs:
      - targets: ['localhost:9100']
root@dlp:~# systemctl enable prometheus prometheus-node-exporter
|
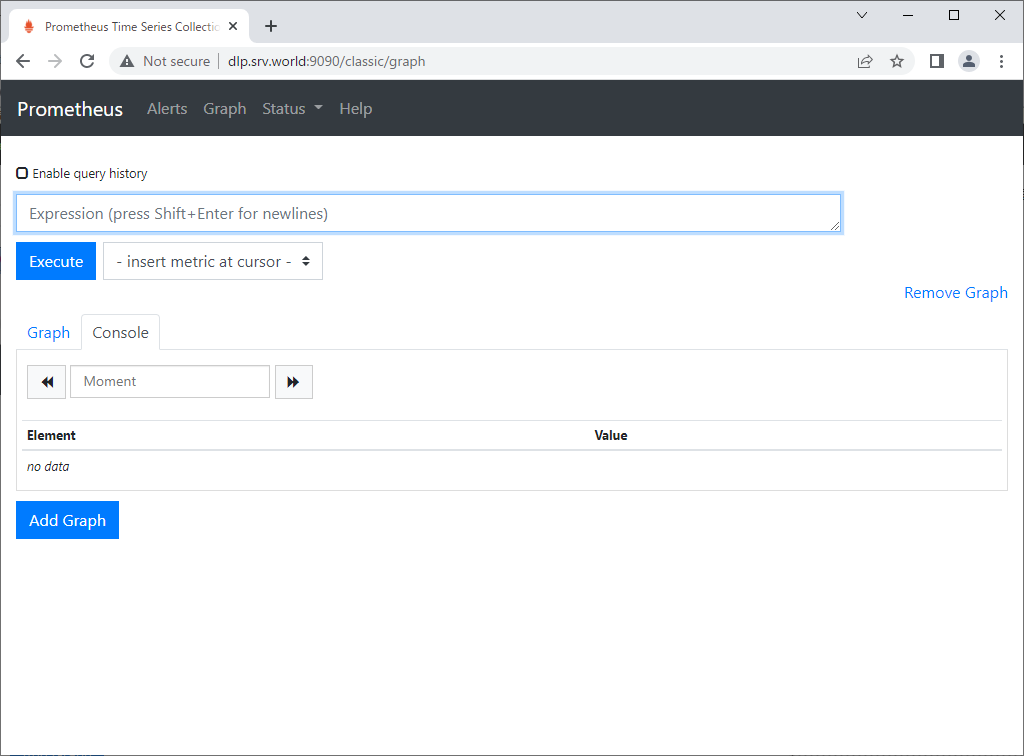
| [3] | क्लाइंट होस्ट से [http://(Prometheus सर्वर का होस्टनाम या आईपी पता):9090/] तक पहुंच, फिर, Prometheus वेब यूआई निम्नानुसार दिखाया गया है। |
|
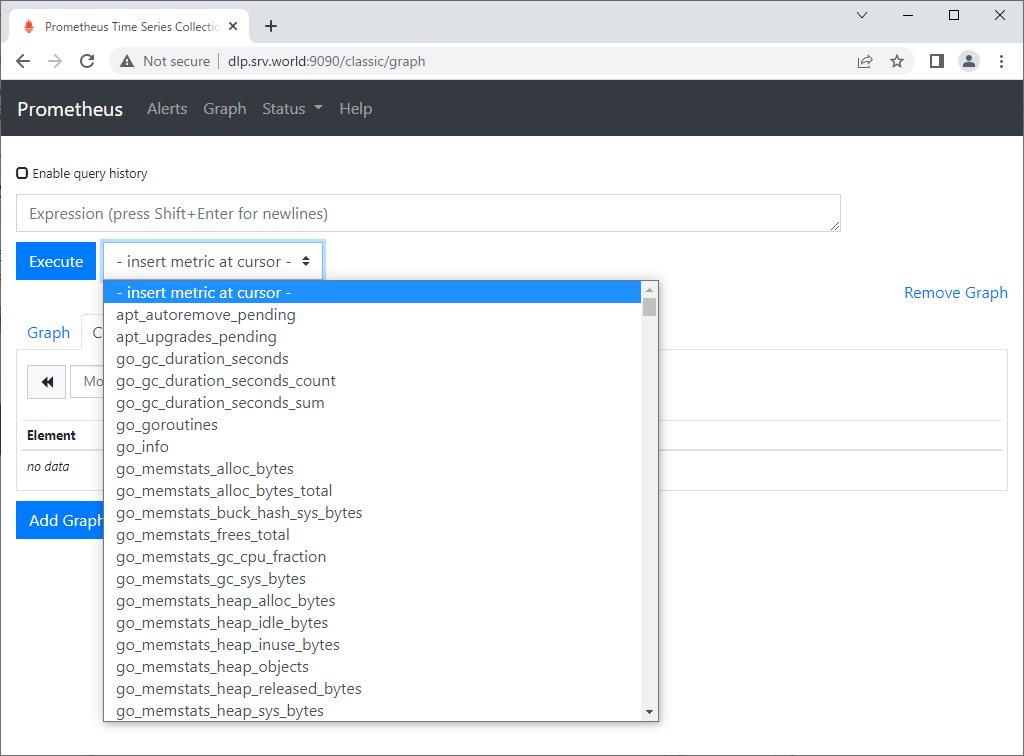
| [4] |
[कर्सर पर मीट्रिक डालें] पर क्लिक करने के लिए, समय श्रृंखला डेटा देखने के लिए कई प्रश्न हैं।
Expression Language के उपयोग के बारे में आधिकारिक दस्तावेज़ देखें।Prometheus [Expression Language] द्वारा उपरोक्त इनपुट फॉर्म पर सीधे प्रश्न इनपुट करना भी संभव है। ⇒ https://prometheus.io/docs/querying/examples/ |
|
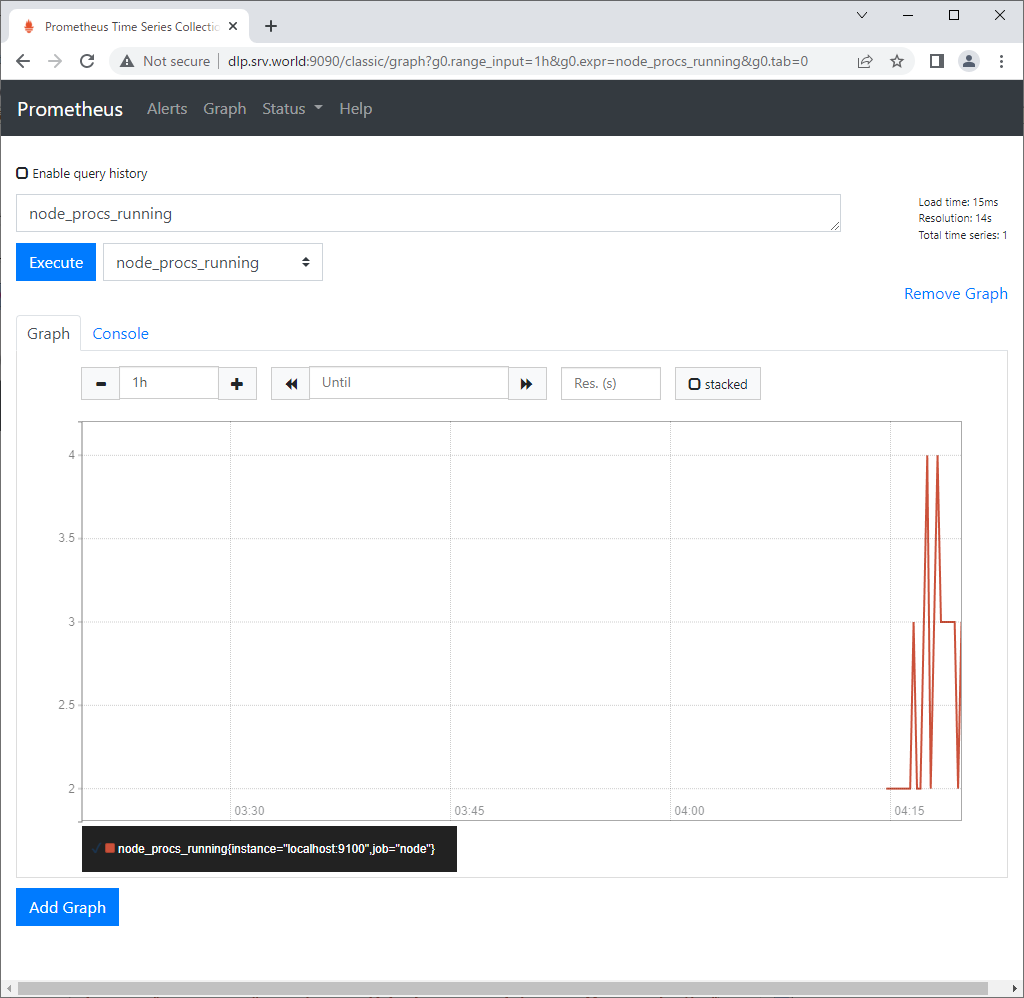
| [5] | यह [node_procs_running] निष्पादित करने की स्थिति है। |
|
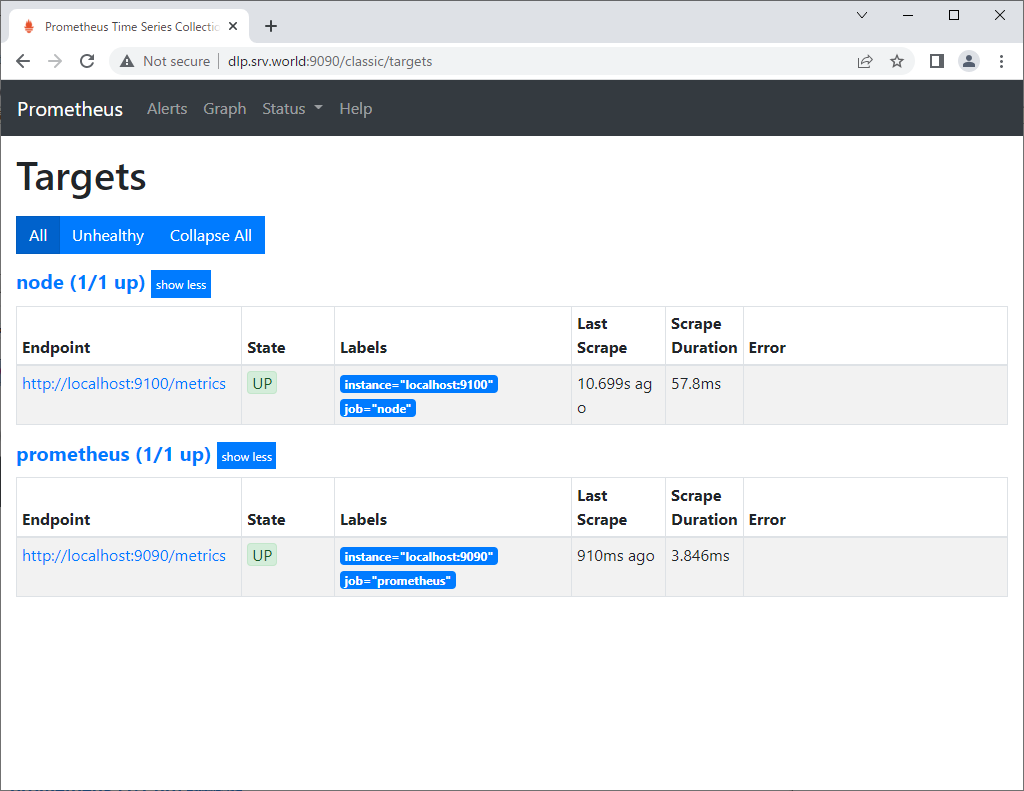
| [6] | [स्थिति] - [लक्ष्य] पर क्लिक करने से, प्रत्येक नोड के लिए स्थिति की पुष्टि करना संभव है। |
|
मिलान सामग्री