Elastic Stack 8 : Packetbeat स्थापित करें2024/08/02 |
|
Packetbeat स्थापित करें जो नेटवर्क पैकेट एकत्र और विश्लेषण करता है। |
|
| [1] | Packetbeat स्थापित करें। इसके पहले Elasticsearch रिपॉजिटरी को कॉन्फ़िगर करें। |
|
root@dlp:~# apt -y install packetbeat
|
| [2] | बुनियादी सेटिंग्स कॉन्फ़िगर करें और पैकेटबीट प्रारंभ करें। |
|
root@dlp:~#
vi /etc/packetbeat/packetbeat.yml # पंक्ति 58 : डेटा एकत्र करने के लिए आइटम सेट करें # यदि ICMPv4/ICMPv6 को अक्षम करें, तो गलत पर जाएँ # पंक्ति 68 और बाद में: कई वस्तुओं को डिफ़ॉल्ट रूप से निगरानी के रूप में लक्षित किया जाता है, # लेकिन यदि आवश्यकता नहीं है, तो पंक्ति पर टिप्पणी करें [ports: ***] packetbeat.protocols: - type: icmp # Enable ICMPv4 and ICMPv6 monitoring. Default: false enabled: true - type: amqp # Configure the ports where to listen for AMQP traffic. You can disable # the AMQP protocol by commenting out the list of ports. ports: [5672] ..... ..... # पंक्ति 181: यदि Kibana का उपयोग करें, तो टिप्पणी हटाएं और आउटपुट होस्ट निर्दिष्ट करें # यदि Kibana पर SSL सक्षम है, तो होस्टनाम प्रमाणपत्रों में होस्टनाम के समान होना चाहिए # [username] और [password] व्यवस्थापक उपयोगकर्ता का है # यदि स्व-हस्ताक्षरित प्रमाणपत्र का उपयोग कर रहे हैं, तो निर्दिष्ट करें [ssl.verification_mode: none] setup.kibana: ..... host: "https://dlp.srv.world:5601" protocol: "https" username: "elastic" password: "password" ssl.enabled: true ssl.verification_mode: none # पंक्ति 217: Elasticsearch का आउटपुट निर्दिष्ट करें # [username] और [password] व्यवस्थापक उपयोगकर्ता का है # [ssl.certificate_authorities] Elasticsearch इंस्टालेशन द्वारा उत्पन्न कैसर्ट है output.elasticsearch: # Array of hosts to connect to. hosts: ["https://dlp.srv.world:9200"] protocol: "https" #api_key: "id:api_key" username: "elastic" password: "password" ssl.certificate_authorities: "/etc/elasticsearch/certs/http_ca.crt" ..... .....
root@dlp:~#
vi /etc/packetbeat/packetbeat.reference.yml # पंक्ति 1864 : यदि Kibana का उपयोग करें, तो टिप्पणी हटाएं और आउटपुट होस्ट निर्दिष्ट करें # यदि Kibana पर SSL सक्षम है, तो SSL संबंधित पंक्तियों पर टिप्पणी हटाएँ # [username] और [password] व्यवस्थापक उपयोगकर्ता का है # यदि स्व-हस्ताक्षरित प्रमाणपत्र का उपयोग कर रहे हैं, तो निर्दिष्ट करें [ssl.verification_mode: none] setup.kibana: # Kibana Host # Scheme and port can be left out and will be set to the default (http and 5601) # In case you specify and additional path, the scheme is required: http://localhost:5601/path # IPv6 addresses should always be defined as: https://[2001:db8::1]:5601 host: "https://dlp.srv.world:5601" # Optional protocol and basic auth credentials. protocol: "https" username: "elastic" password: "password" # Optional HTTP Path #path: "" # Use SSL settings for HTTPS. Default is true. ssl.enabled: true ..... ..... # after very careful consideration. It is primarily intended as a temporary # diagnostic mechanism when attempting to resolve TLS errors; its use in # production environments is strongly discouraged. # The default value is full. ssl.verification_mode: noneroot@dlp:~# systemctl enable --now packetbeat
|
| [3] | स्थिति सत्यापित करें कि डेटा सामान्य रूप से एकत्र किया गया है। |
|
# सूचकांक सूची root@dlp:~# curl -u elastic --cacert /etc/elasticsearch/certs/http_ca.crt https://127.0.0.1:9200/_cat/indices?v Enter host password for user 'elastic' health status index uuid pri rep docs.count docs.deleted store.size pri.store.size dataset.size green open .internal.alerts-transform.health.alerts-default-000001 3MDAnVqWRkC_ucXp_f-dRg 1 0 0 0 249b 249b 249b green open .internal.alerts-observability.logs.alerts-default-000001 virq6rX_TAadxqKMrIr4tQ 1 0 0 0 249b 249b 249b green open .internal.alerts-observability.uptime.alerts-default-000001 46XZFk5FRl28WLwbzBCRCw 1 0 0 0 249b 249b 249b green open .internal.alerts-ml.anomaly-detection.alerts-default-000001 03VHbmGgSIOuhotRgmO1Yw 1 0 0 0 249b 249b 249b green open .internal.alerts-observability.slo.alerts-default-000001 IaTLW9hYRIm8y1ikEzlN2g 1 0 0 0 249b 249b 249b green open .internal.alerts-default.alerts-default-000001 XpCXm0SYQa2o_uT14iMPyw 1 0 0 0 249b 249b 249b green open .internal.alerts-observability.apm.alerts-default-000001 0OrsLwbDRVWozBNNt1RAOA 1 0 0 0 249b 249b 249b green open .internal.alerts-observability.metrics.alerts-default-000001 yQqehuwnTN-ndP0O-YoqYg 1 0 0 0 249b 249b 249b green open .kibana-observability-ai-assistant-conversations-000001 ctEkgFQkTc-2Fec_91qYJA 1 0 0 0 249b 249b 249b green open .internal.alerts-ml.anomaly-detection-health.alerts-default-000001 34FcMwC0S26Gw6PQlsAgHA 1 0 0 0 249b 249b 249b green open .internal.alerts-observability.threshold.alerts-default-000001 b9DylGvaSp6Glf8y8lKITA 1 0 0 0 249b 249b 249b yellow open .ds-packetbeat-8.14.3-2024.08.02-000001 x32rSrQQSu6HYkyypcMQzA 1 1 58 0 111.7kb 111.7kb 111.7kb green open .kibana-observability-ai-assistant-kb-000001 bde5sw2OTaO0TX18GPGY8Q 1 0 0 0 249b 249b 249b green open .internal.alerts-security.alerts-default-000001 09-NNzj9SBK7QC9yzpFreQ 1 0 0 0 249b 249b 249b yellow open test_index KB7PcAnESd6F8Gz4BJz7AA 1 1 1 0 6.5kb 6.5kb 6.5kb yellow open .ds-metricbeat-8.14.3-2024.08.02-000001 3QM_SeQkRZG-Um9Dopq9Iw 1 1 2079 0 4.5mb 4.5mb 4.5mb green open .internal.alerts-stack.alerts-default-000001 yh_lotA4Q0KsZAx4iIGNig 1 0 0 0 249b 249b 249b # सूचकांक पर दस्तावेज़ सूची root@dlp:~# curl -u elastic --cacert /etc/elasticsearch/certs/http_ca.crt https://127.0.0.1:9200/.ds-packetbeat-8.14.3-2024.08.02-000001/_search?pretty
Enter host password for user 'elastic':
{
  "took" : 1,
  "timed_out" : false,
  "_shards" : {
    "total" : 1,
    "successful" : 1,
    "skipped" : 0,
    "failed" : 0
  },
  "hits" : {
    "total" : {
      "value" : 624,
      "relation" : "eq"
    },
    "max_score" : 1.0,
    "hits" : [
      {
        "_index" : ".ds-packetbeat-8.14.3-2024.08.02-000001",
        "_id" : "fLDEEJEBh42v6JiL2_CK",
        "_score" : 1.0,
        "_source" : {
          "server" : {
            "port" : 53,
            "bytes" : 92,
            "ip" : "127.0.0.53"
          },
.....
.....
|
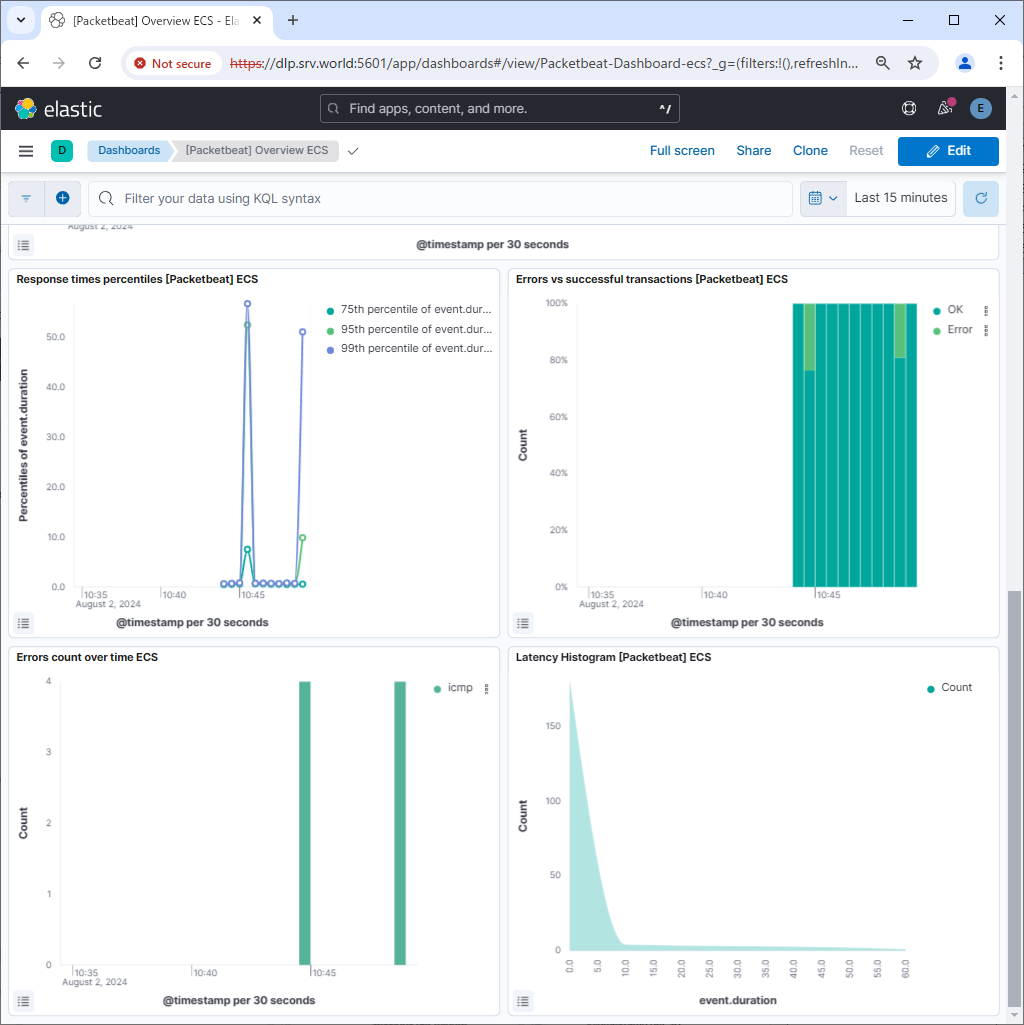
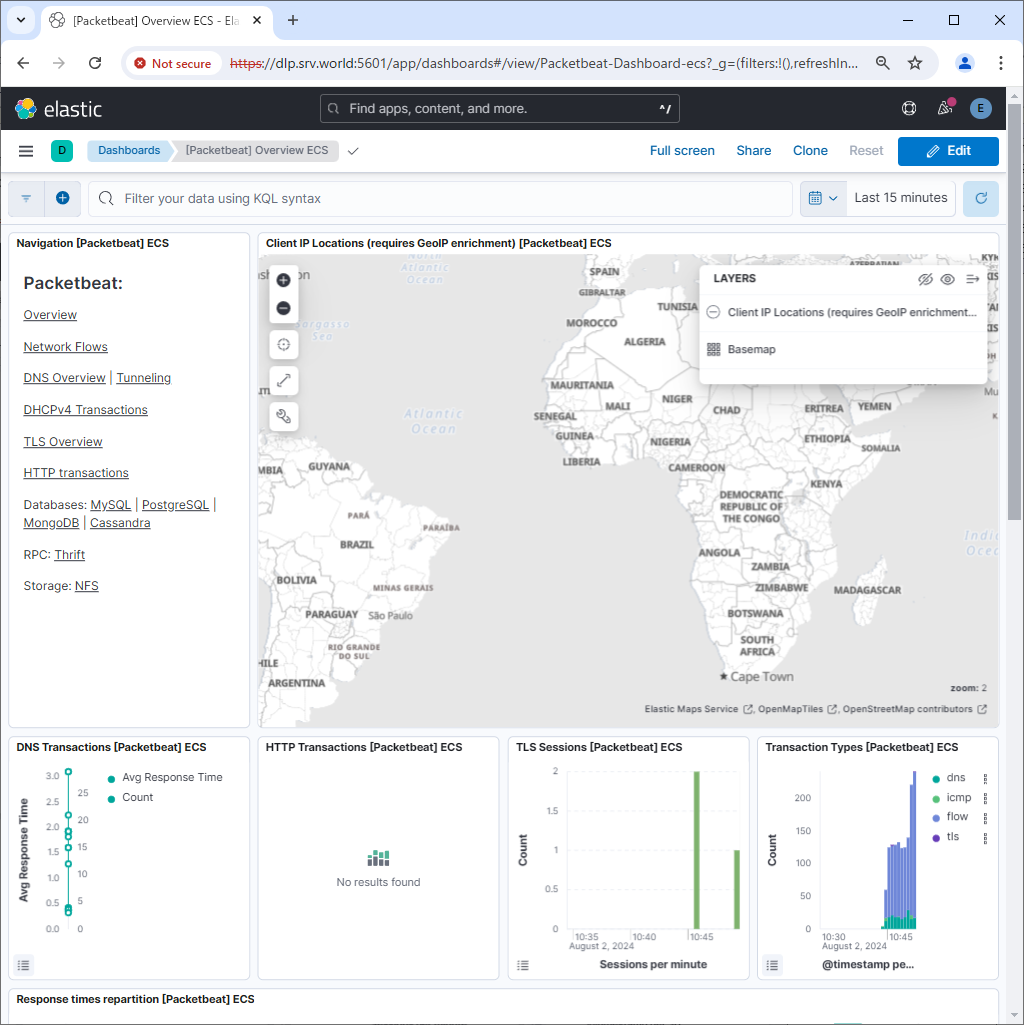
| [4] | यदि Kibana चल रहा है, नमूना डैशबोर्ड में डेटा आयात करना संभव है। |
|
root@dlp:~# packetbeat setup --dashboards Loading dashboards (Kibana must be running and reachable) Loaded dashboards |
|
|
मिलान सामग्री