Kubernetes : Prometheus でモニタリングする2025/01/27 |
|
Prometheus をインストールして、Kubernetes クラスターの各種メトリクスをモニタリングできるようにします。 当例では以下のように 4 台のノードを使用して Kubernetes クラスターを構成しています。
+----------------------+   +----------------------+
|  [ ctrl.srv.world ]  |   |   [ dlp.srv.world ]  |
|     Manager Node     |   |     Control Plane    |
+-----------+----------+   +-----------+----------+
        eth0|10.0.0.25             eth0|10.0.0.30
            |                          |
------------+--------------------------+-----------
            |                          |
        eth0|10.0.0.51             eth0|10.0.0.52
+-----------+----------+   +-----------+----------+
| [ node01.srv.world ] |   | [ node02.srv.world ] |
|     Worker Node#1    |   |     Worker Node#2    |
+----------------------+   +----------------------+
|
| [1] |
Prometheus が使用する外部ストレージが必要となります。 |
| [2] | Helm で Prometheus チャートをインストールします。 |
|
# Prometheus の設定を書き出して自身の環境用に変更 [cent@ctrl ~]$ helm inspect values bitnami/kube-prometheus > prometheus.yaml
[cent@ctrl ~]$
vi prometheus.yaml
.....
.....
    21行目 : 使用する storageClass を指定
    defaultStorageClass: "nfs-client"
.....
.....
.....
    1261行目 : 使用する storageClass を指定
    storageClass: "nfs-client"
.....
.....
.....
    2346行目 : 使用する storageClass を指定
    storageClass: "nfs-client"
# Prometheus 用のネームスペース作成 [cent@ctrl ~]$ kubectl create namespace monitoring namespace/monitoring created helm install prometheus --namespace monitoring -f prometheus.yaml bitnami/kube-prometheus
NAME: prometheus
LAST DEPLOYED: Mon Jan 27 11:43:14 2025
NAMESPACE: monitoring
STATUS: deployed
REVISION: 1
TEST SUITE: None
NOTES:
CHART NAME: kube-prometheus
CHART VERSION: 10.2.4
APP VERSION: 0.79.2

Did you know there are enterprise versions of the Bitnami catalog? For enhanced secure software supply chain features, unlimited pulls from Docker, LTS support, or application customization, see Bitnami Premium or Tanzu Application Catalog. See https://www.arrow.com/globalecs/na/vendors/bitnami for more information.

** Please be patient while the chart is being deployed **

Watch the Prometheus Operator Deployment status using the command:

    kubectl get deploy -w --namespace monitoring -l app.kubernetes.io/name=kube-prometheus-operator,app.kubernetes.io/instance=prometheus

Watch the Prometheus StatefulSet status using the command:

    kubectl get sts -w --namespace monitoring -l app.kubernetes.io/name=kube-prometheus-prometheus,app.kubernetes.io/instance=prometheus

Prometheus can be accessed via port "9090" on the following DNS name from within your cluster:

    prometheus-kube-prometheus-prometheus.monitoring.svc.cluster.local

To access Prometheus from outside the cluster execute the following commands:

    echo "Prometheus URL: http://127.0.0.1:9090/"
    kubectl port-forward --namespace monitoring svc/prometheus-kube-prometheus-prometheus 9090:9090

Watch the Alertmanager StatefulSet status using the command:

    kubectl get sts -w --namespace monitoring -l app.kubernetes.io/name=kube-prometheus-alertmanager,app.kubernetes.io/instance=prometheus

Alertmanager can be accessed via port "9093" on the following DNS name from within your cluster:

    prometheus-kube-prometheus-alertmanager.monitoring.svc.cluster.local

To access Alertmanager from outside the cluster execute the following commands:

    echo "Alertmanager URL: http://127.0.0.1:9093/"
    kubectl port-forward --namespace monitoring svc/prometheus-kube-prometheus-alertmanager 9093:9093

WARNING: There are "resources" sections in the chart not set. Using "resourcesPreset" is not recommended for production. For production installations, please set the following values according to your workload needs:
  - alertmanager.resources
  - blackboxExporter.resources
  - operator.resources
  - prometheus.resources
  - prometheus.thanos.resources
+info https://kubernetes.io/docs/concepts/configuration/manage-resources-containers/
[cent@ctrl ~]$ kubectl get pods -n monitoring NAME READY STATUS RESTARTS AGE alertmanager-prometheus-kube-prometheus-alertmanager-0 2/2 Running 0 76s prometheus-kube-prometheus-blackbox-exporter-6b99c88b6d-g7zqz 1/1 Running 0 89s prometheus-kube-prometheus-operator-57c6c84f6c-fll9m 1/1 Running 0 89s prometheus-kube-state-metrics-6df44d5556-xrjfd 1/1 Running 0 89s prometheus-node-exporter-h5khh 1/1 Running 0 89s prometheus-node-exporter-zwh2b 1/1 Running 0 89s prometheus-prometheus-kube-prometheus-prometheus-0 2/2 Running 0 76s # もしクラスター外からアクセスする場合はポートフォワード [cent@ctrl ~]$ kubectl port-forward -n monitoring service/prometheus-kube-prometheus-prometheus --address 0.0.0.0 9090:9090 & |
| [3] | Grafana もインストールする場合は、同様にインストール可能です。 |
|
# 設定を書き出して storageClassName を変更 [cent@ctrl ~]$ helm inspect values bitnami/grafana > grafana.yaml
[cent@ctrl ~]$
vi grafana.yaml 618行目 : 自身の [storageClass] を指定 persistence: enabled: true ## If defined, storageClassName: <storageClass> ## If set to "-", storageClassName: "", which disables dynamic provisioning ## If undefined (the default) or set to null, no storageClassName spec is ## set, choosing the default provisioner. (gp2 on AWS, standard on ## GKE, AWS & OpenStack) ## storageClass: "nfs-client"[cent@ctrl ~]$ helm install grafana --namespace monitoring -f grafana.yaml bitnami/grafana
NAME: grafana
LAST DEPLOYED: Mon Jan 27 11:48:48 2025
NAMESPACE: monitoring
STATUS: deployed
REVISION: 1
TEST SUITE: None
NOTES:
CHART NAME: grafana
CHART VERSION: 11.4.4
APP VERSION: 11.4.0

Did you know there are enterprise versions of the Bitnami catalog? For enhanced secure software supply chain features, unlimited pulls from Docker, LTS support, or application customization, see Bitnami Premium or Tanzu Application Catalog. See https://www.arrow.com/globalecs/na/vendors/bitnami for more information.

** Please be patient while the chart is being deployed **

1. Get the application URL by running these commands:
    echo "Browse to http://127.0.0.1:8080"
    kubectl port-forward svc/grafana 8080:3000 &

2. Get the admin credentials:

    echo "User: admin"
    echo "Password: $(kubectl get secret grafana-admin --namespace monitoring -o jsonpath="{.data.GF_SECURITY_ADMIN_PASSWORD}" | base64 -d)"
# Note: Do not include grafana.validateValues.database here. See https://github.com/bitnami/charts/issues/20629


WARNING: There are "resources" sections in the chart not set. Using "resourcesPreset" is not recommended for production. For production installations, please set the following values according to your workload needs:
  - grafana.resources
+info https://kubernetes.io/docs/concepts/configuration/manage-resources-containers/
[cent@ctrl ~]$ kubectl get pods -n monitoring NAME READY STATUS RESTARTS AGE alertmanager-prometheus-kube-prometheus-alertmanager-0 2/2 Running 0 6m17s grafana-5495c54848-vt5v8 1/1 Running 0 57s prometheus-kube-prometheus-blackbox-exporter-6b99c88b6d-g7zqz 1/1 Running 0 6m30s prometheus-kube-prometheus-operator-57c6c84f6c-fll9m 1/1 Running 0 6m30s prometheus-kube-state-metrics-6df44d5556-xrjfd 1/1 Running 0 6m30s prometheus-node-exporter-h5khh 1/1 Running 0 6m30s prometheus-node-exporter-zwh2b 1/1 Running 0 6m30s prometheus-prometheus-kube-prometheus-prometheus-0 2/2 Running 0 6m17s # もしクラスター外からアクセスする場合はポートフォワード [cent@ctrl ~]$ kubectl port-forward -n monitoring service/grafana --address 0.0.0.0 3000:3000 & |
| [4] |
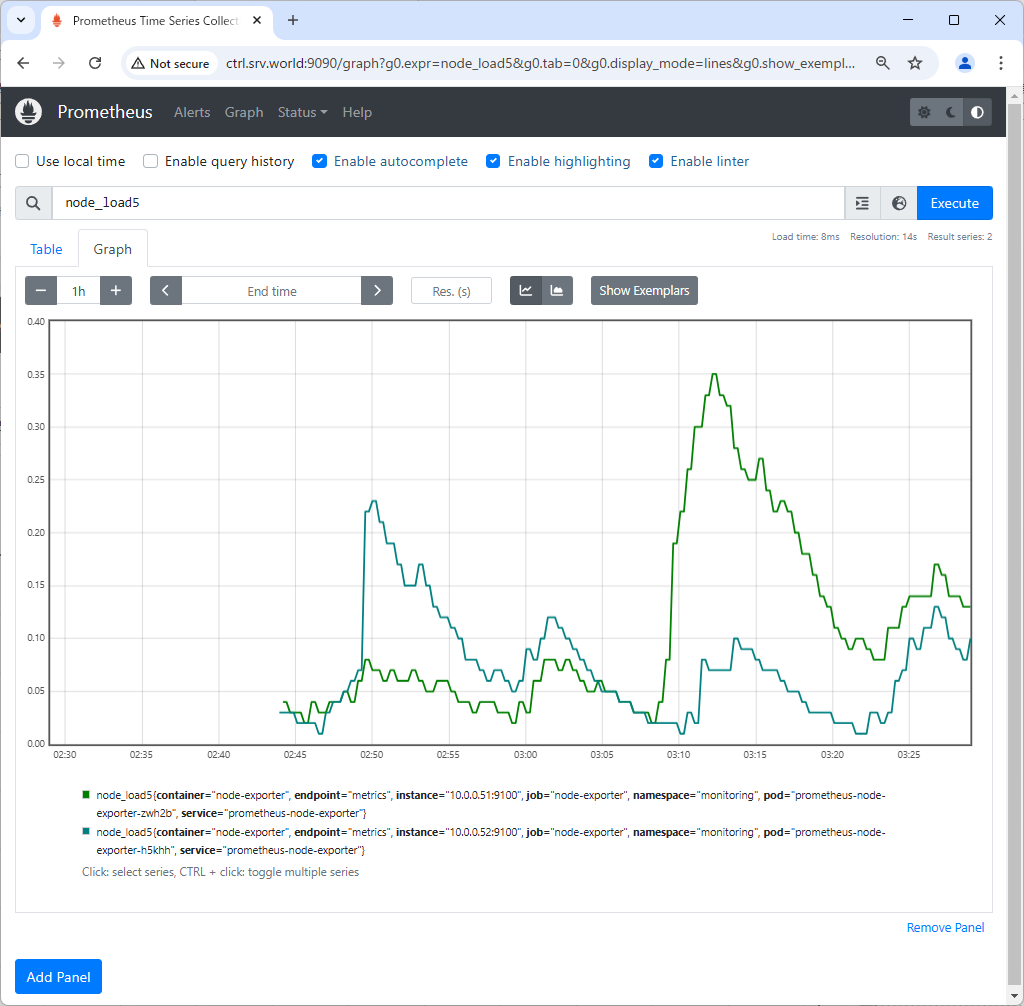
クラスタ―内ホストから Prometheus UI にアクセスする場合は Web ブラウザーを起動して、以下の URL にアクセスします。 ⇒ http://prometheus-kube-prometheus-prometheus.monitoring.svc.cluster.local ポートフォワーディングした場合は、ローカルネットワーク内の任意のコンピューターで Web ブラウザーを起動して、以下の URL にアクセスします。 ⇒ http://(Manager ノードのホスト名 または IP アドレス):(設定したポート)/ 以下のように Prometheus UI が表示されれば OK です。 |

|
|
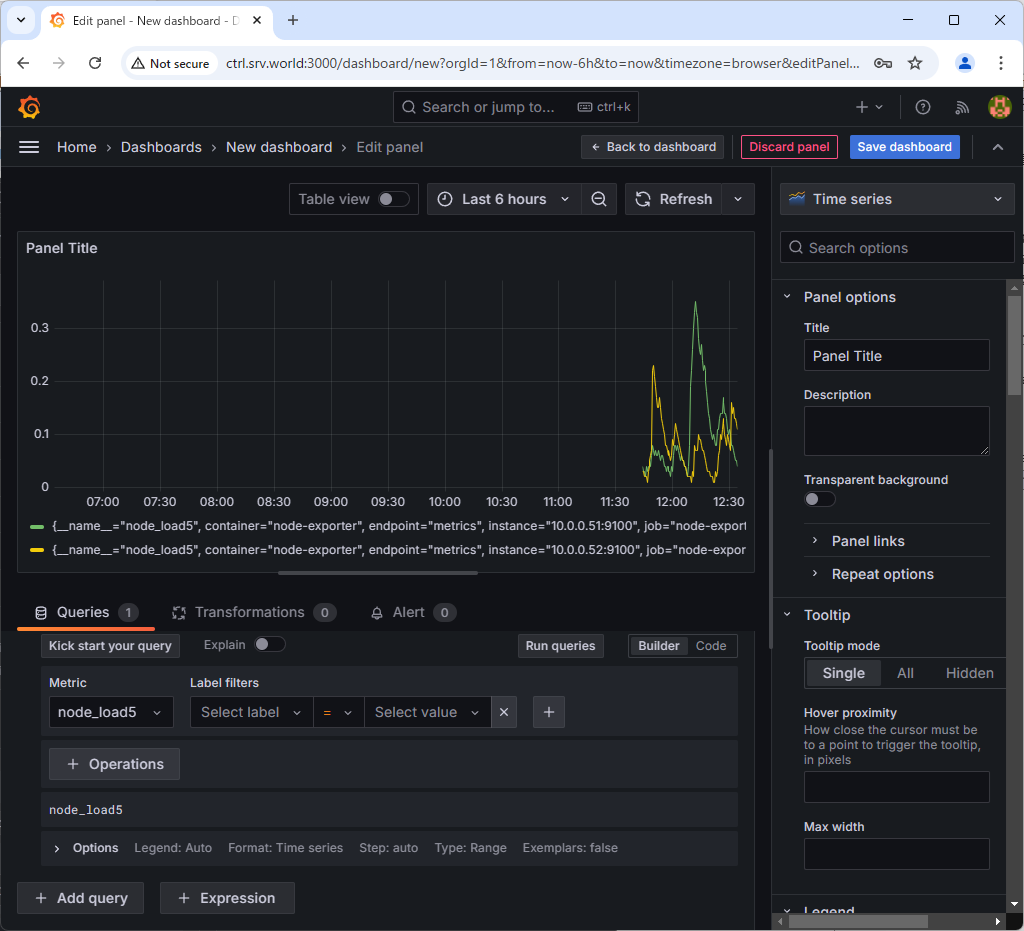
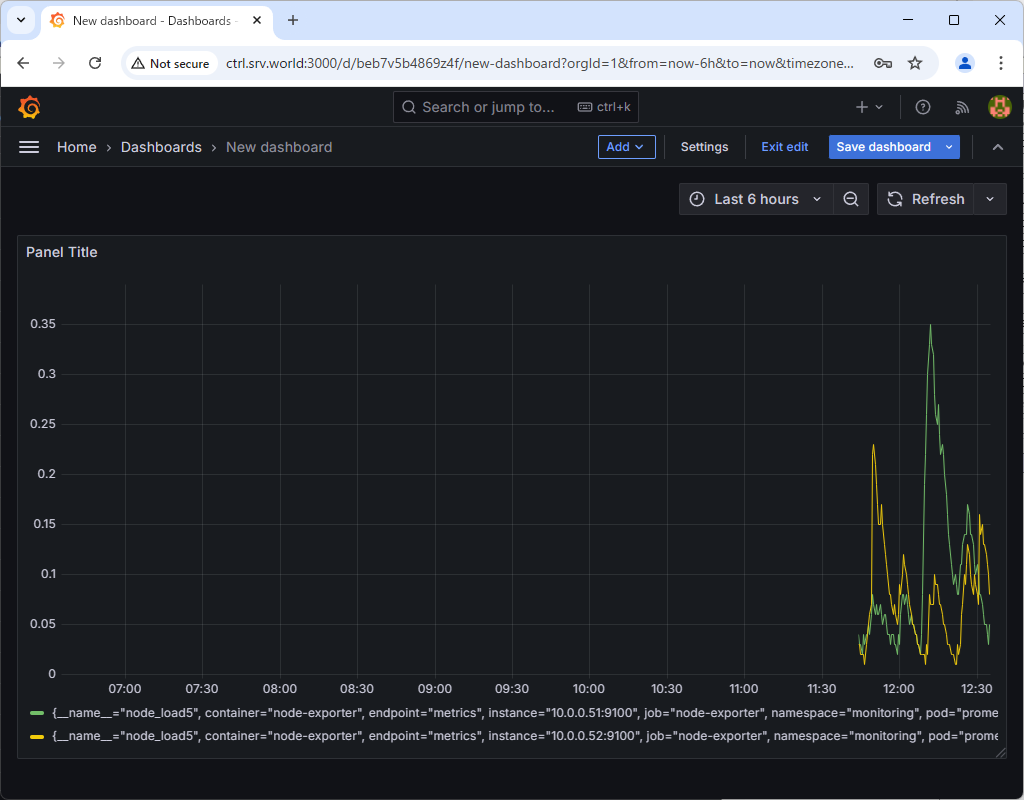
| [5] |
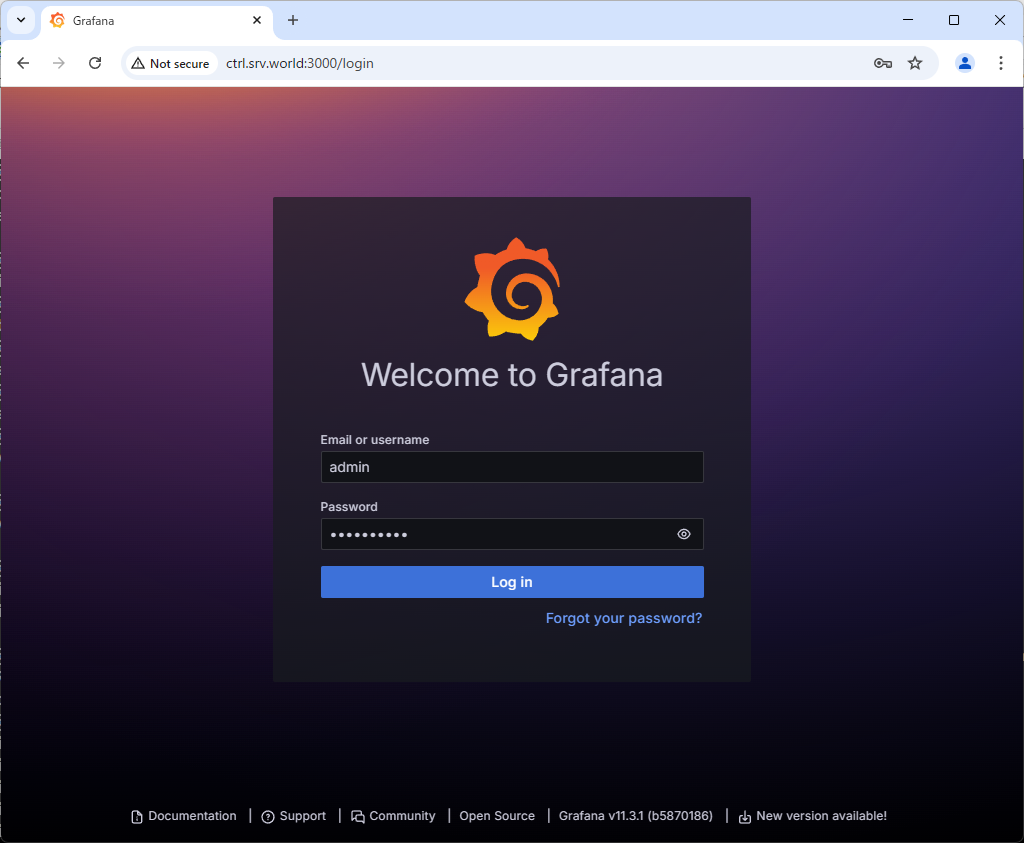
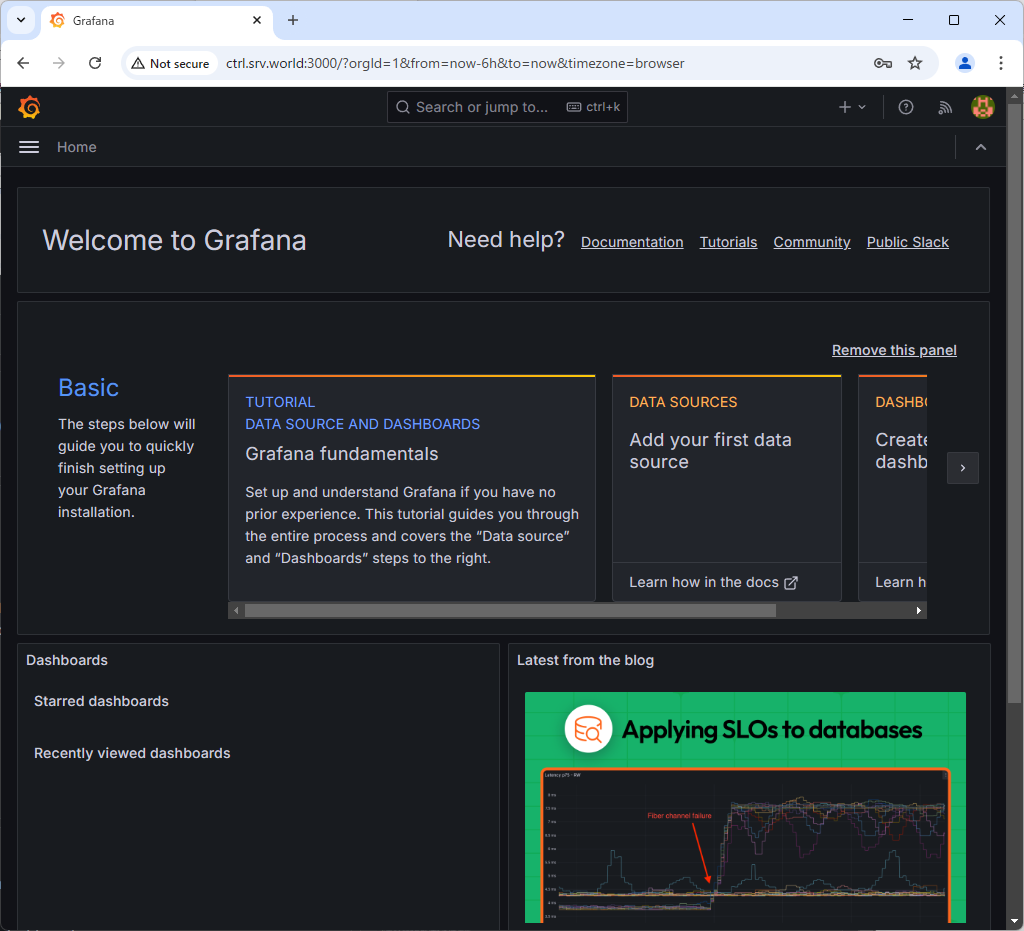
クラスタ―内ホストから Grafana にアクセスする場合は Web ブラウザーを起動して、以下の URL にアクセスします。 ⇒ http://grafana.monitoring.svc.cluster.local ポートフォワーディングした場合は、ローカルネットワーク内の任意のコンピューターで Web ブラウザーを起動して、以下の URL にアクセスします。 ⇒ http://(Manager ノードのホスト名 または IP アドレス):(設定したポート)/ 以下のように Grafana が表示されれば OK です。 [admin] パスワードは以下のコマンドで確認します。⇒ echo "Password: $(kubectl get secret grafana-admin --namespace monitoring -o jsonpath="{.data.GF_SECURITY_ADMIN_PASSWORD}" | base64 -d)" |
|
|
|
|
|