Prometheus : 監視対象ノードを追加する2024/09/06 |
|
監視対象ノードを追加したい場合は以下のように設定します。 |
|
| [1] | CPU やメモリーなどの一般的なシステムリソースのデータを取得する [node-exporter] パッケージを、新たに追加したいノードへインストールします。 |
|
root@node01:~ #
root@node01:~ # pkg install -y node_exporter service node_exporter enable root@node01:~ # service node_exporter start
|
| [2] | Prometheus サーバー側で設定を追加します。 |
|
root@dlp:~ #
vi /usr/local/etc/prometheus.yml
.....
.....
scrape_configs:
  # The job name is added as a label `job=<job_name>` to any timeseries scraped from this config.
  - job_name: "prometheus"

    # metrics_path defaults to '/metrics'
    # scheme defaults to 'http'.
    scheme: https
    tls_config:
      cert_file: /usr/local/etc/server.crt
      key_file: /usr/local/etc/server.key
      insecure_skip_verify: true
    basic_auth:
      username: 'admin'
      password: 'password'

    static_configs:
      - targets: ["localhost:9090"]

  - job_name: node
    # targets にホストを追加
    static_configs:
      - targets: ['localhost:9100', 'node01.srv.world:9100']

  # または グループを分けたい場合は上例ではなく
  # 以下のように [job_name] セクションを追加して設定する
  # [job_name] は任意の名前
  - job_name: Hiroshima
    static_configs:
      - targets: ['node01.srv.world:9100']
root@dlp:~ # service prometheus restart
|
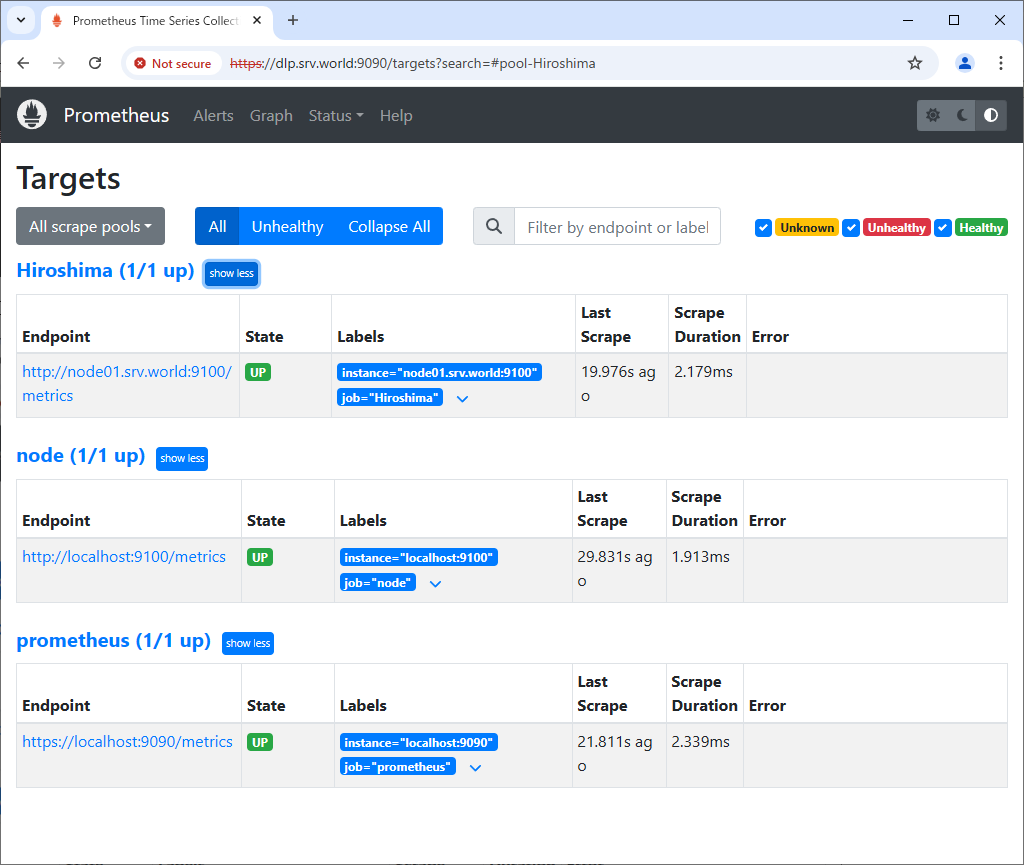
| [3] | Prometheus Web UI へアクセスし、[Status] - [Targets] をクリックして、設定したホストが追加されているか確認します。 |
|
|
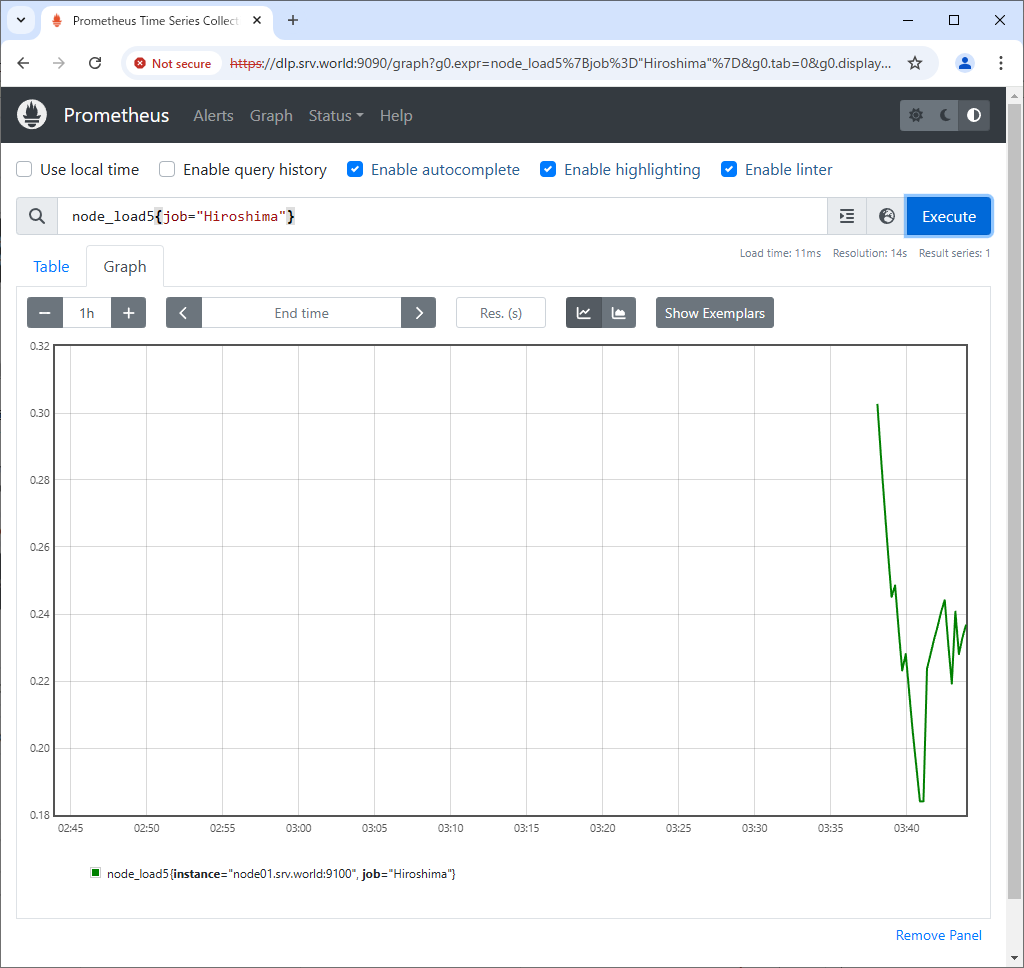
| [4] | クエリーを直接入力することでジョブやノードを絞って表示することもできます。 下例は node_load5{job="Hiroshima"} に含まれるノードを表示 |
|
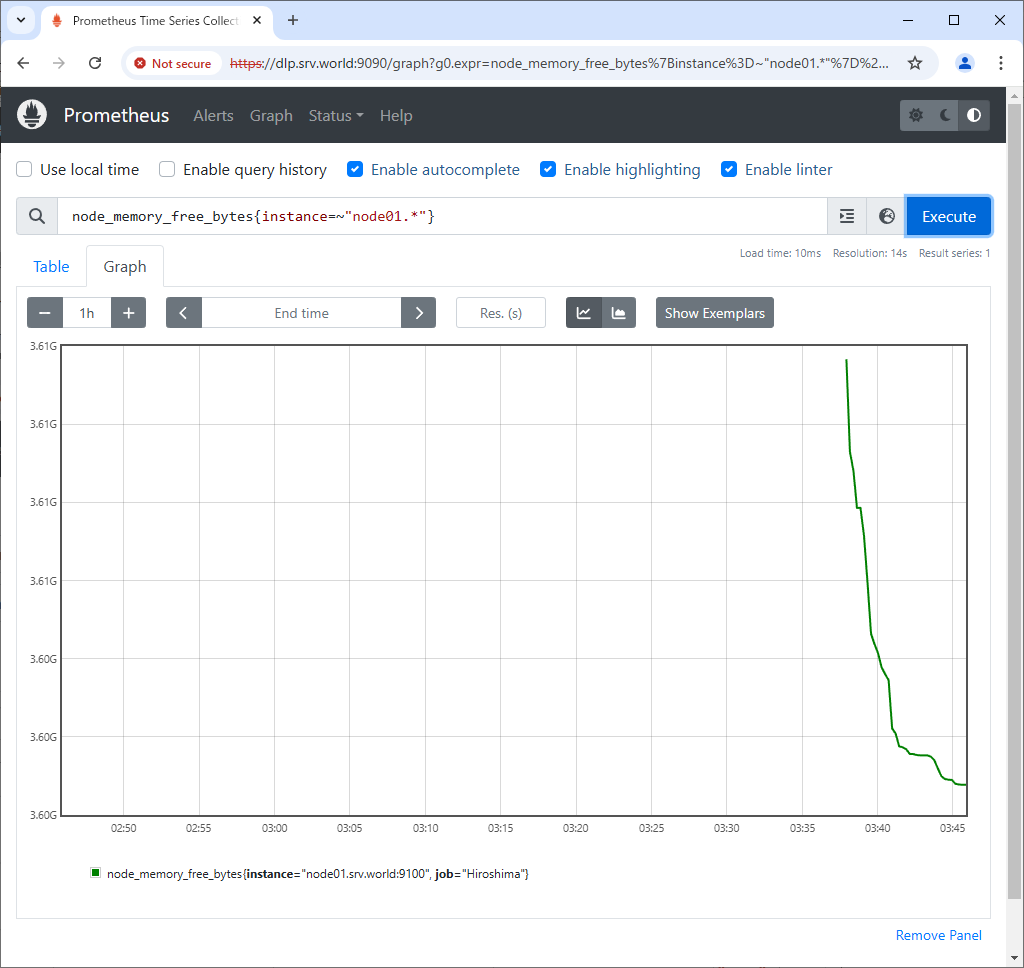
| [5] | 下例は node_memory_free_bytes{instance=~"node01.*"} に合致するノードを表示 |
|
関連コンテンツ