Prometheus : 監視対象ノードを追加する (Windows)2024/09/06 |
|
Windows コンピューターを監視対象ノードとして追加したい場合は以下のように設定します。 |
|
| [1] |
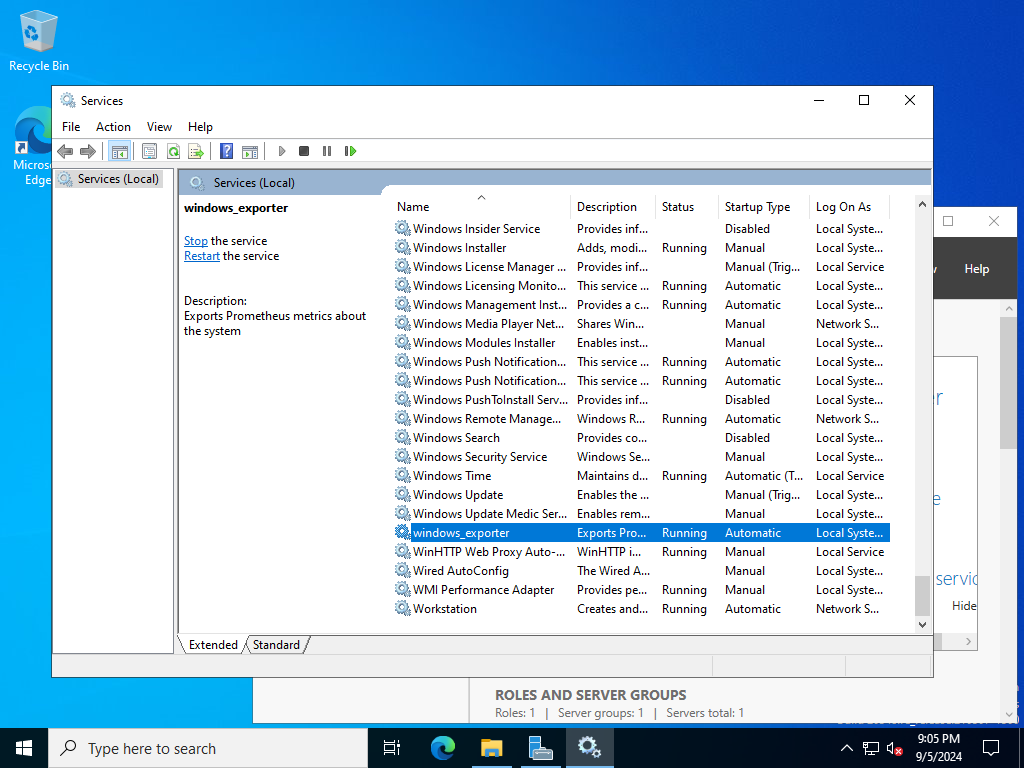
対象の Windows コンピューターに [Windows exporter] をインストールします。 ⇒ https://github.com/prometheus-community/windows_exporter/releases |
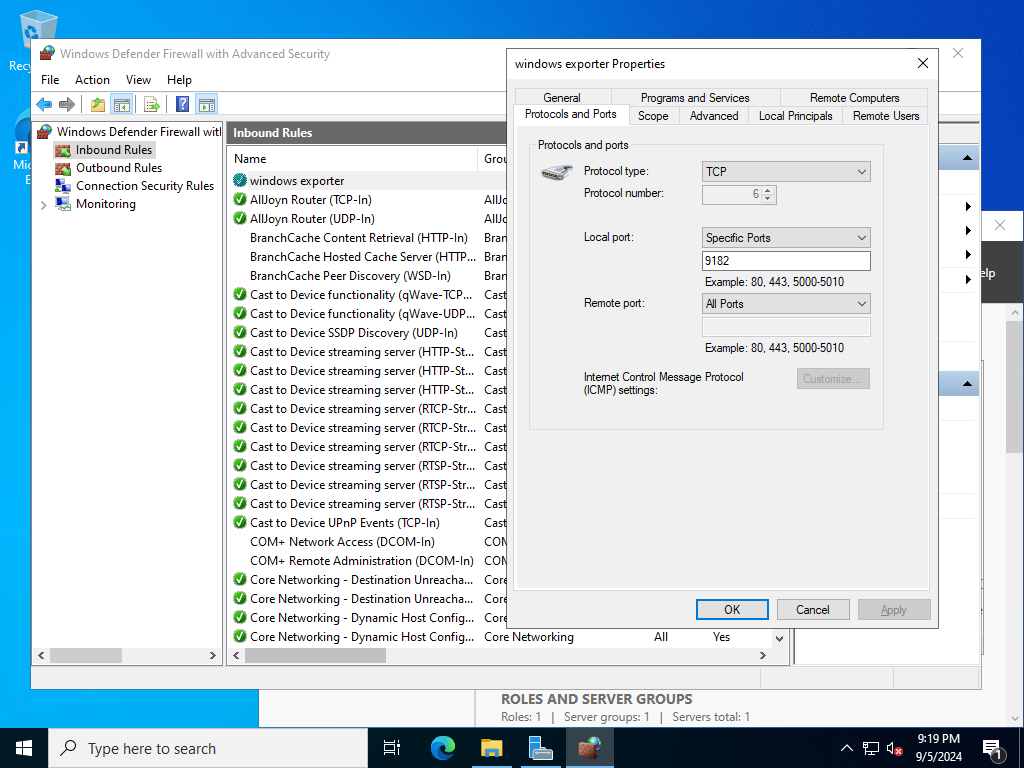
| [2] | インストールすると [windows_exporter] が起動し、ポート [9182] をリスンします。 Windows Firewall にも許可ルールが登録されます。(登録されない場合は手動で追加) |
|
|
| [3] | Prometheus サーバー側で設定を追加します。 |
|
root@dlp:~ #
vi /usr/local/etc/prometheus.yml
.....
.....
scrape_configs:
  # The job name is added as a label `job=<job_name>` to any timeseries scraped from this config.
  - job_name: "prometheus"

    # metrics_path defaults to '/metrics'
    # scheme defaults to 'http'.
    scheme: https
    tls_config:
      cert_file: /usr/local/etc/server.crt
      key_file: /usr/local/etc/server.key
      insecure_skip_verify: true
    basic_auth:
      username: 'admin'
      password: 'password'

    static_configs:
      - targets: ["localhost:9090"]

  - job_name: node
    # targets に Windows ホストを追加
    static_configs:
      - targets: ['localhost:9100', 'rx-7.srv.world:9182']

  # または グループを分けたい場合は上例ではなく
  # 以下のように [job_name] セクションを追加して設定する
  # [job_name] は任意の名前
  - job_name: Windows
    static_configs:
      - targets: ['rx-7.srv.world:9182']
root@dlp:~ # service prometheus restart |
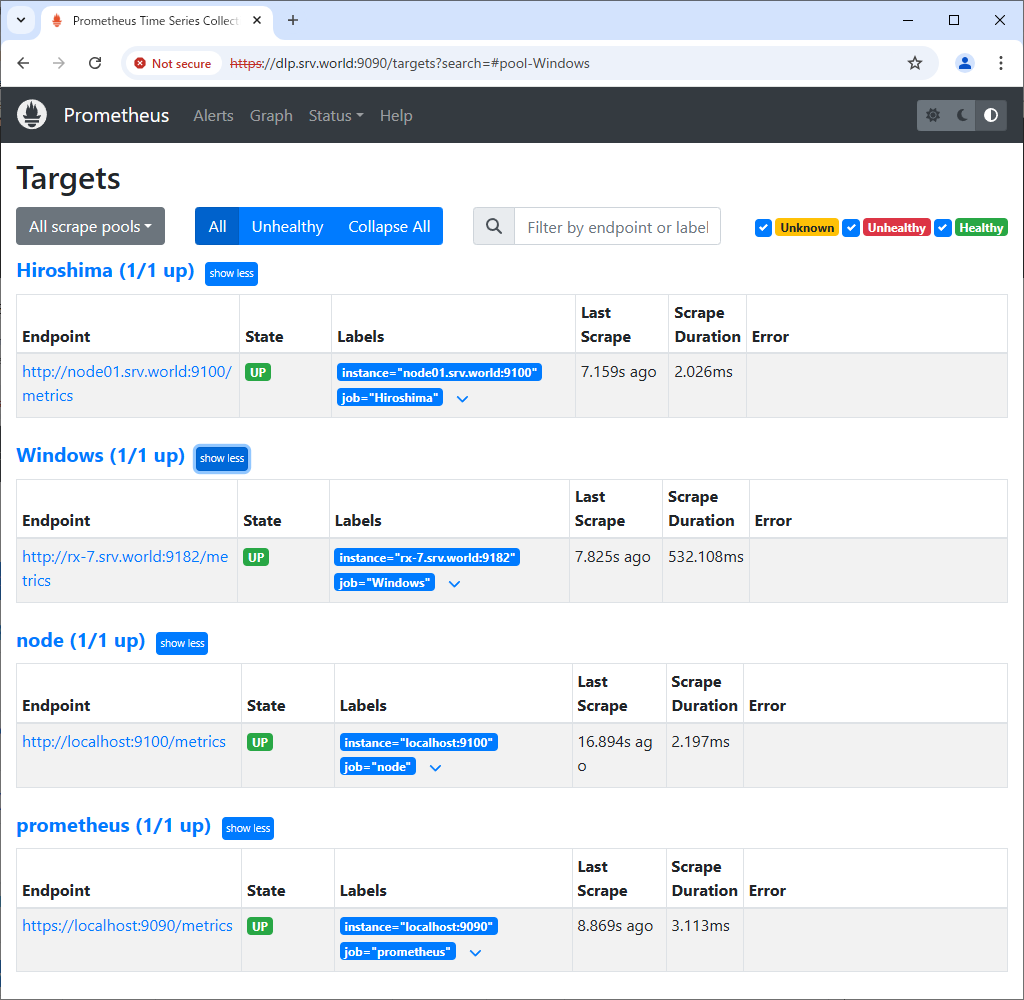
| [4] | Prometheus Web UI へアクセスし、[Status] - [Targets] をクリックして、設定したホストが追加されているか確認します。 |
|
|
|
関連コンテンツ