Elastic Stack 8 : Packetbeat インストール2024/08/02 |
|
ネットワークパケット情報のデータ収集機能を提供する Packetbeat をインストールします。 |
|
| [1] | Packetbeat をインストールします。 事前に Elasticsearch リポジトリ設定済みであることが前提です。 |
|
root@dlp:~# apt -y install packetbeat
|
| [2] | 基本的な設定をして Packetbeat を起動します。 |
|
root@dlp:~#
vi /etc/packetbeat/packetbeat.yml # 58行目 : 収集する項目を設定 # ICMPv4/ICMPv6 を無効にする場合は false に設定 # 68行目以降 : デフォルトで多くのポートが監視対象となっているが # 無効にする場合は [ports: ***] をコメントアウト packetbeat.protocols: - type: icmp # Enable ICMPv4 and ICMPv6 monitoring. Default: false enabled: true - type: amqp # Configure the ports where to listen for AMQP traffic. You can disable # the AMQP protocol by commenting out the list of ports. ports: [5672] ..... ..... # 181行目 : Kibana を使用する場合はコメント解除して出力先を指定 # Kibana で SSL 有効の場合は証明書に登録したホスト名と合わせる # [username], [password] は管理ユーザーのユーザー名とパスワード # 自己署名の証明書を使用している場合は [ssl.verification_mode: none] setup.kibana: ..... host: "https://dlp.srv.world:5601" protocol: "https" username: "elastic" password: "password" ssl.enabled: true ssl.verification_mode: none # 217行目 : Elasticsearch の出力先を指定する # [username], [password] は管理ユーザーのユーザー名とパスワード # [ssl.certificate_authorities] は Elasticsearch で生成された cacert output.elasticsearch: # Array of hosts to connect to. hosts: ["https://dlp.srv.world:9200"] protocol: "https" #api_key: "id:api_key" username: "elastic" password: "password" ssl.certificate_authorities: "/etc/elasticsearch/certs/http_ca.crt" ..... .....
root@dlp:~#
vi /etc/packetbeat/packetbeat.reference.yml # 1864行目 : Kibana を使用する場合はコメント解除して出力先を指定 # Kibana で SSL 有効の場合は ssl 系設定をコメント解除 # [username], [password] は管理ユーザーのユーザー名とパスワード # 自己署名の証明書を使用している場合は [ssl.verification_mode: none] setup.kibana: # Kibana Host # Scheme and port can be left out and will be set to the default (http and 5601) # In case you specify and additional path, the scheme is required: http://localhost:5601/path # IPv6 addresses should always be defined as: https://[2001:db8::1]:5601 host: "https://dlp.srv.world:5601" # Optional protocol and basic auth credentials. protocol: "https" username: "elastic" password: "password" # Optional HTTP Path #path: "" # Use SSL settings for HTTPS. Default is true. ssl.enabled: true ..... ..... # after very careful consideration. It is primarily intended as a temporary # diagnostic mechanism when attempting to resolve TLS errors; its use in # production environments is strongly discouraged. # The default value is full. ssl.verification_mode: noneroot@dlp:~# systemctl enable --now packetbeat
|
| [3] | データが取り込まれているか確認しておきます。 |
|
# index 一覧 root@dlp:~# curl -u elastic --cacert /etc/elasticsearch/certs/http_ca.crt https://127.0.0.1:9200/_cat/indices?v Enter host password for user 'elastic' health status index uuid pri rep docs.count docs.deleted store.size pri.store.size dataset.size green open .internal.alerts-transform.health.alerts-default-000001 3MDAnVqWRkC_ucXp_f-dRg 1 0 0 0 249b 249b 249b green open .internal.alerts-observability.logs.alerts-default-000001 virq6rX_TAadxqKMrIr4tQ 1 0 0 0 249b 249b 249b green open .internal.alerts-observability.uptime.alerts-default-000001 46XZFk5FRl28WLwbzBCRCw 1 0 0 0 249b 249b 249b green open .internal.alerts-ml.anomaly-detection.alerts-default-000001 03VHbmGgSIOuhotRgmO1Yw 1 0 0 0 249b 249b 249b green open .internal.alerts-observability.slo.alerts-default-000001 IaTLW9hYRIm8y1ikEzlN2g 1 0 0 0 249b 249b 249b green open .internal.alerts-default.alerts-default-000001 XpCXm0SYQa2o_uT14iMPyw 1 0 0 0 249b 249b 249b green open .internal.alerts-observability.apm.alerts-default-000001 0OrsLwbDRVWozBNNt1RAOA 1 0 0 0 249b 249b 249b green open .internal.alerts-observability.metrics.alerts-default-000001 yQqehuwnTN-ndP0O-YoqYg 1 0 0 0 249b 249b 249b green open .kibana-observability-ai-assistant-conversations-000001 ctEkgFQkTc-2Fec_91qYJA 1 0 0 0 249b 249b 249b green open .internal.alerts-ml.anomaly-detection-health.alerts-default-000001 34FcMwC0S26Gw6PQlsAgHA 1 0 0 0 249b 249b 249b green open .internal.alerts-observability.threshold.alerts-default-000001 b9DylGvaSp6Glf8y8lKITA 1 0 0 0 249b 249b 249b yellow open .ds-packetbeat-8.14.3-2024.08.02-000001 x32rSrQQSu6HYkyypcMQzA 1 1 58 0 111.7kb 111.7kb 111.7kb green open .kibana-observability-ai-assistant-kb-000001 bde5sw2OTaO0TX18GPGY8Q 1 0 0 0 249b 249b 249b green open .internal.alerts-security.alerts-default-000001 09-NNzj9SBK7QC9yzpFreQ 1 0 0 0 249b 249b 249b yellow open test_index KB7PcAnESd6F8Gz4BJz7AA 1 1 1 0 6.5kb 6.5kb 6.5kb yellow open .ds-metricbeat-8.14.3-2024.08.02-000001 3QM_SeQkRZG-Um9Dopq9Iw 1 1 2079 0 4.5mb 4.5mb 4.5mb green open .internal.alerts-stack.alerts-default-000001 yh_lotA4Q0KsZAx4iIGNig 1 0 0 0 249b 249b 249b # index のドキュメント一覧 root@dlp:~# curl -u elastic --cacert /etc/elasticsearch/certs/http_ca.crt https://127.0.0.1:9200/.ds-packetbeat-8.14.3-2024.08.02-000001/_search?pretty
Enter host password for user 'elastic':
{
  "took" : 1,
  "timed_out" : false,
  "_shards" : {
    "total" : 1,
    "successful" : 1,
    "skipped" : 0,
    "failed" : 0
  },
  "hits" : {
    "total" : {
      "value" : 624,
      "relation" : "eq"
    },
    "max_score" : 1.0,
    "hits" : [
      {
        "_index" : ".ds-packetbeat-8.14.3-2024.08.02-000001",
        "_id" : "fLDEEJEBh42v6JiL2_CK",
        "_score" : 1.0,
        "_source" : {
          "server" : {
            "port" : 53,
            "bytes" : 92,
            "ip" : "127.0.0.53"
          },
.....
.....
|
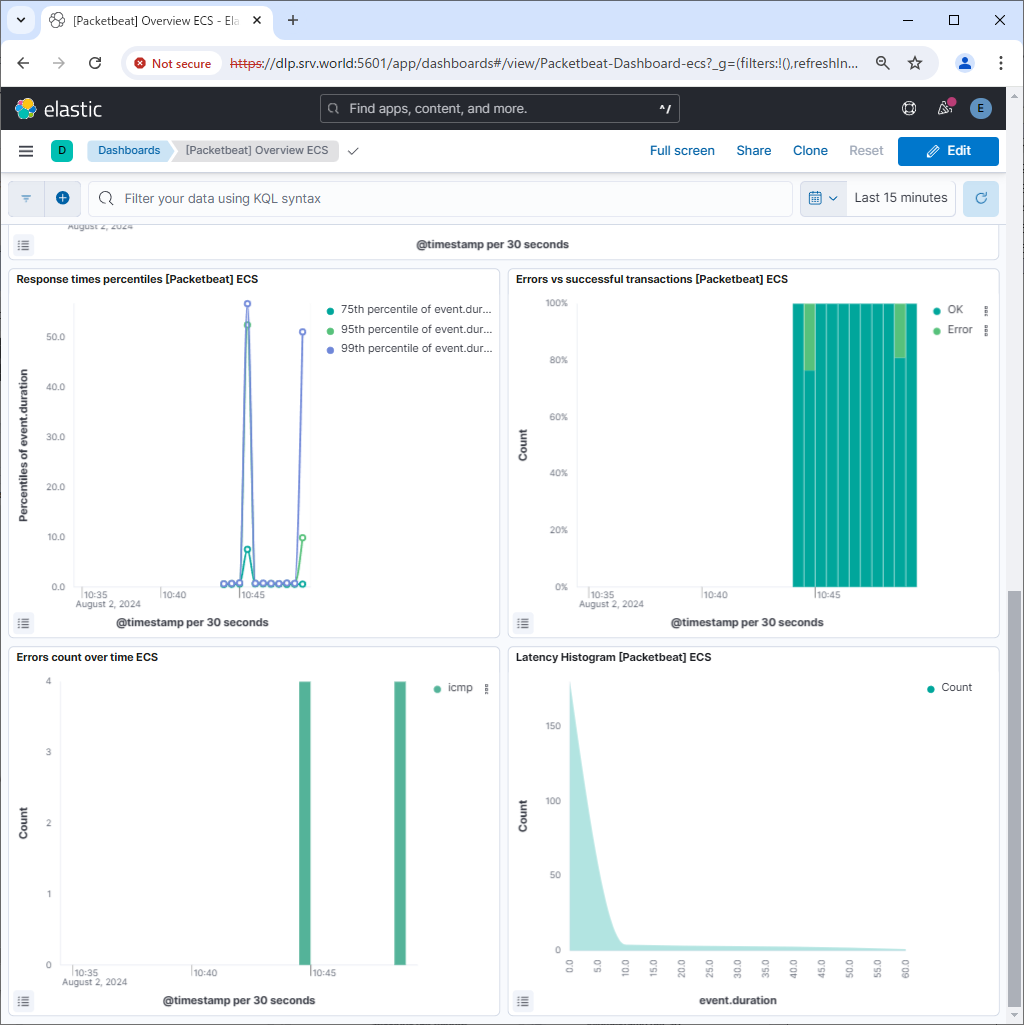
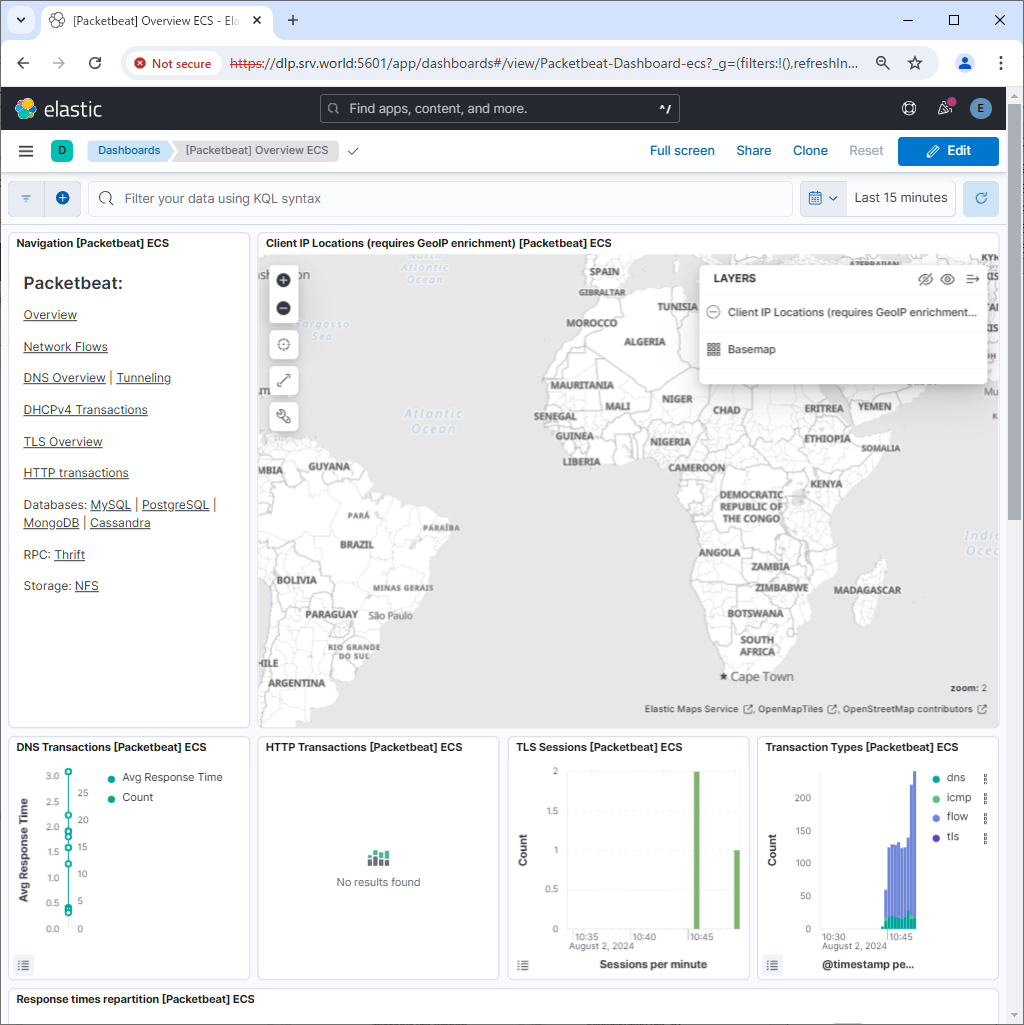
| [4] | Kibana を稼働させている場合は、サンプルダッシュボードへのデータインポートが可能です。 |
|
root@dlp:~# packetbeat setup --dashboards Loading dashboards (Kibana must be running and reachable) Loaded dashboards |
|
|
関連コンテンツ